
The higher lows in the S&P 500 Index are giving investors and traders some hope. Will the gains continue?
We’re heading into the Thanksgiving holiday with a somewhat positive outlook from the stock markets. After a challenging year, with the markets reaching their all-time highs in January and then trending lower and lower, many investors saw their portfolio values decline significantly. Other notable events that popped up this year included Russia’s invasion of Ukraine, inflation, and rising interest rates. That’s a lot to deal with.
Change Ahead?
We are seeing signs that may be a tad bit encouraging for the U.S. economy. After four 75-basis-point rate hikes, the Fed is leaning towards slowing the pace of said interest rate hikes. Ahead of the Fed minutes, the broader markets showed gains early in the trading day, but fluctuated ahead of the announcement. There’s always the possibility that the Fed may come across as more hawkish than anticipated.
The stock market liked what it heard. The S&P 500 Index ($SPX), Dow Jones Industrial Average ($INDU), and Nasdaq Composite ($COMPQ) all popped after the Fed minutes. Although we can expect further rate hikes, there appears to be strong support for slowing down the rise in rates. Consumer and business spending is softening and higher mortgage rates seem to be slowing housing activity.
Technically Speaking
In the weekly chart of $SPX in chart 1, you can see that $SPX is hanging out between its 38.2% and 23.6% Fibonacci retracement levels (using 2020 low and January 2022 high as the low and high levels).
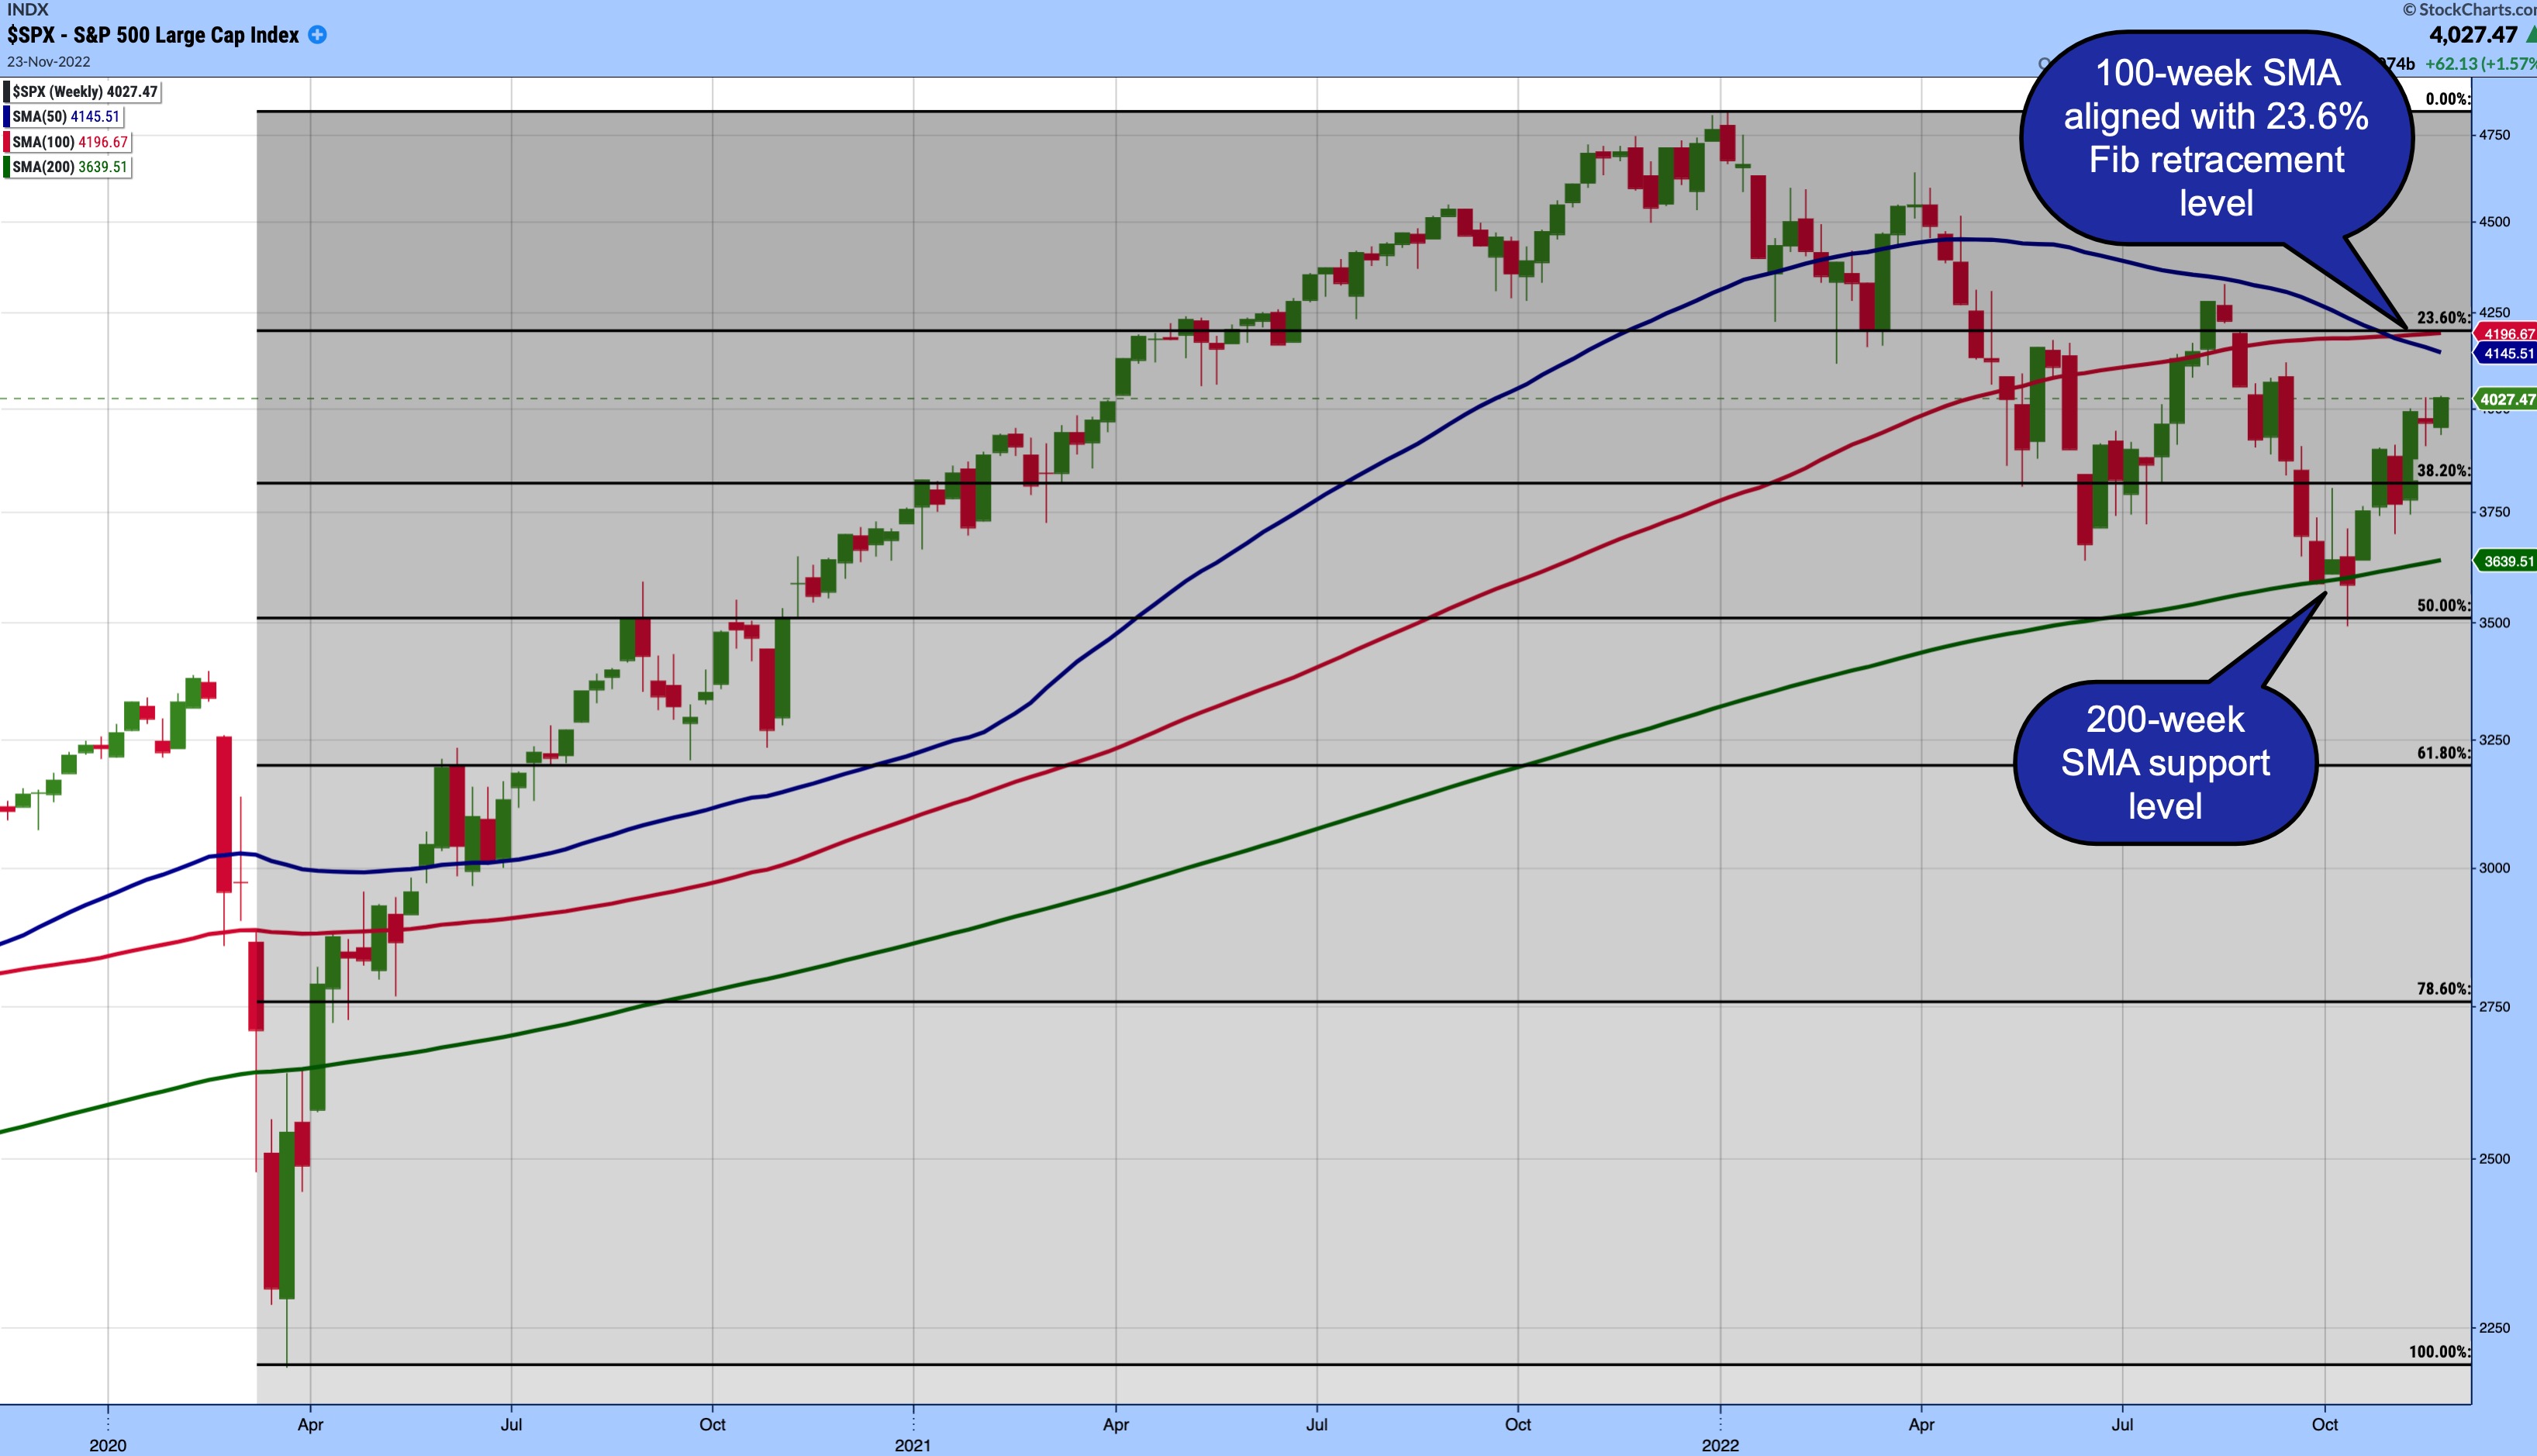
CHART 1: A POP AFTER FED MINUTES. The S&P 500 Index is hanging on to its November gains ahead of the Thanksgiving holiday as it moves between its 38.2% and 23.6% Fibonacci retracement levels.Chart source: StockChartsACP from StockCharts.com
The 200-week simple moving average (SMA) acted as a support level for the October low, from which $SPX bounced from. Note that the 200-week SMA is trending upward. There’s a chance that the downward-sloping 50-week SMA could act as the next resistance level, but the one to watch would be the 100-week SMA. If it continues to align with the 23.6% Fibonacci retracement level, that could as a strong resistance level.
Using the same Fibonacci retracement levels from the weekly chart, let’s switch to the one-year daily chart (see chart 2).
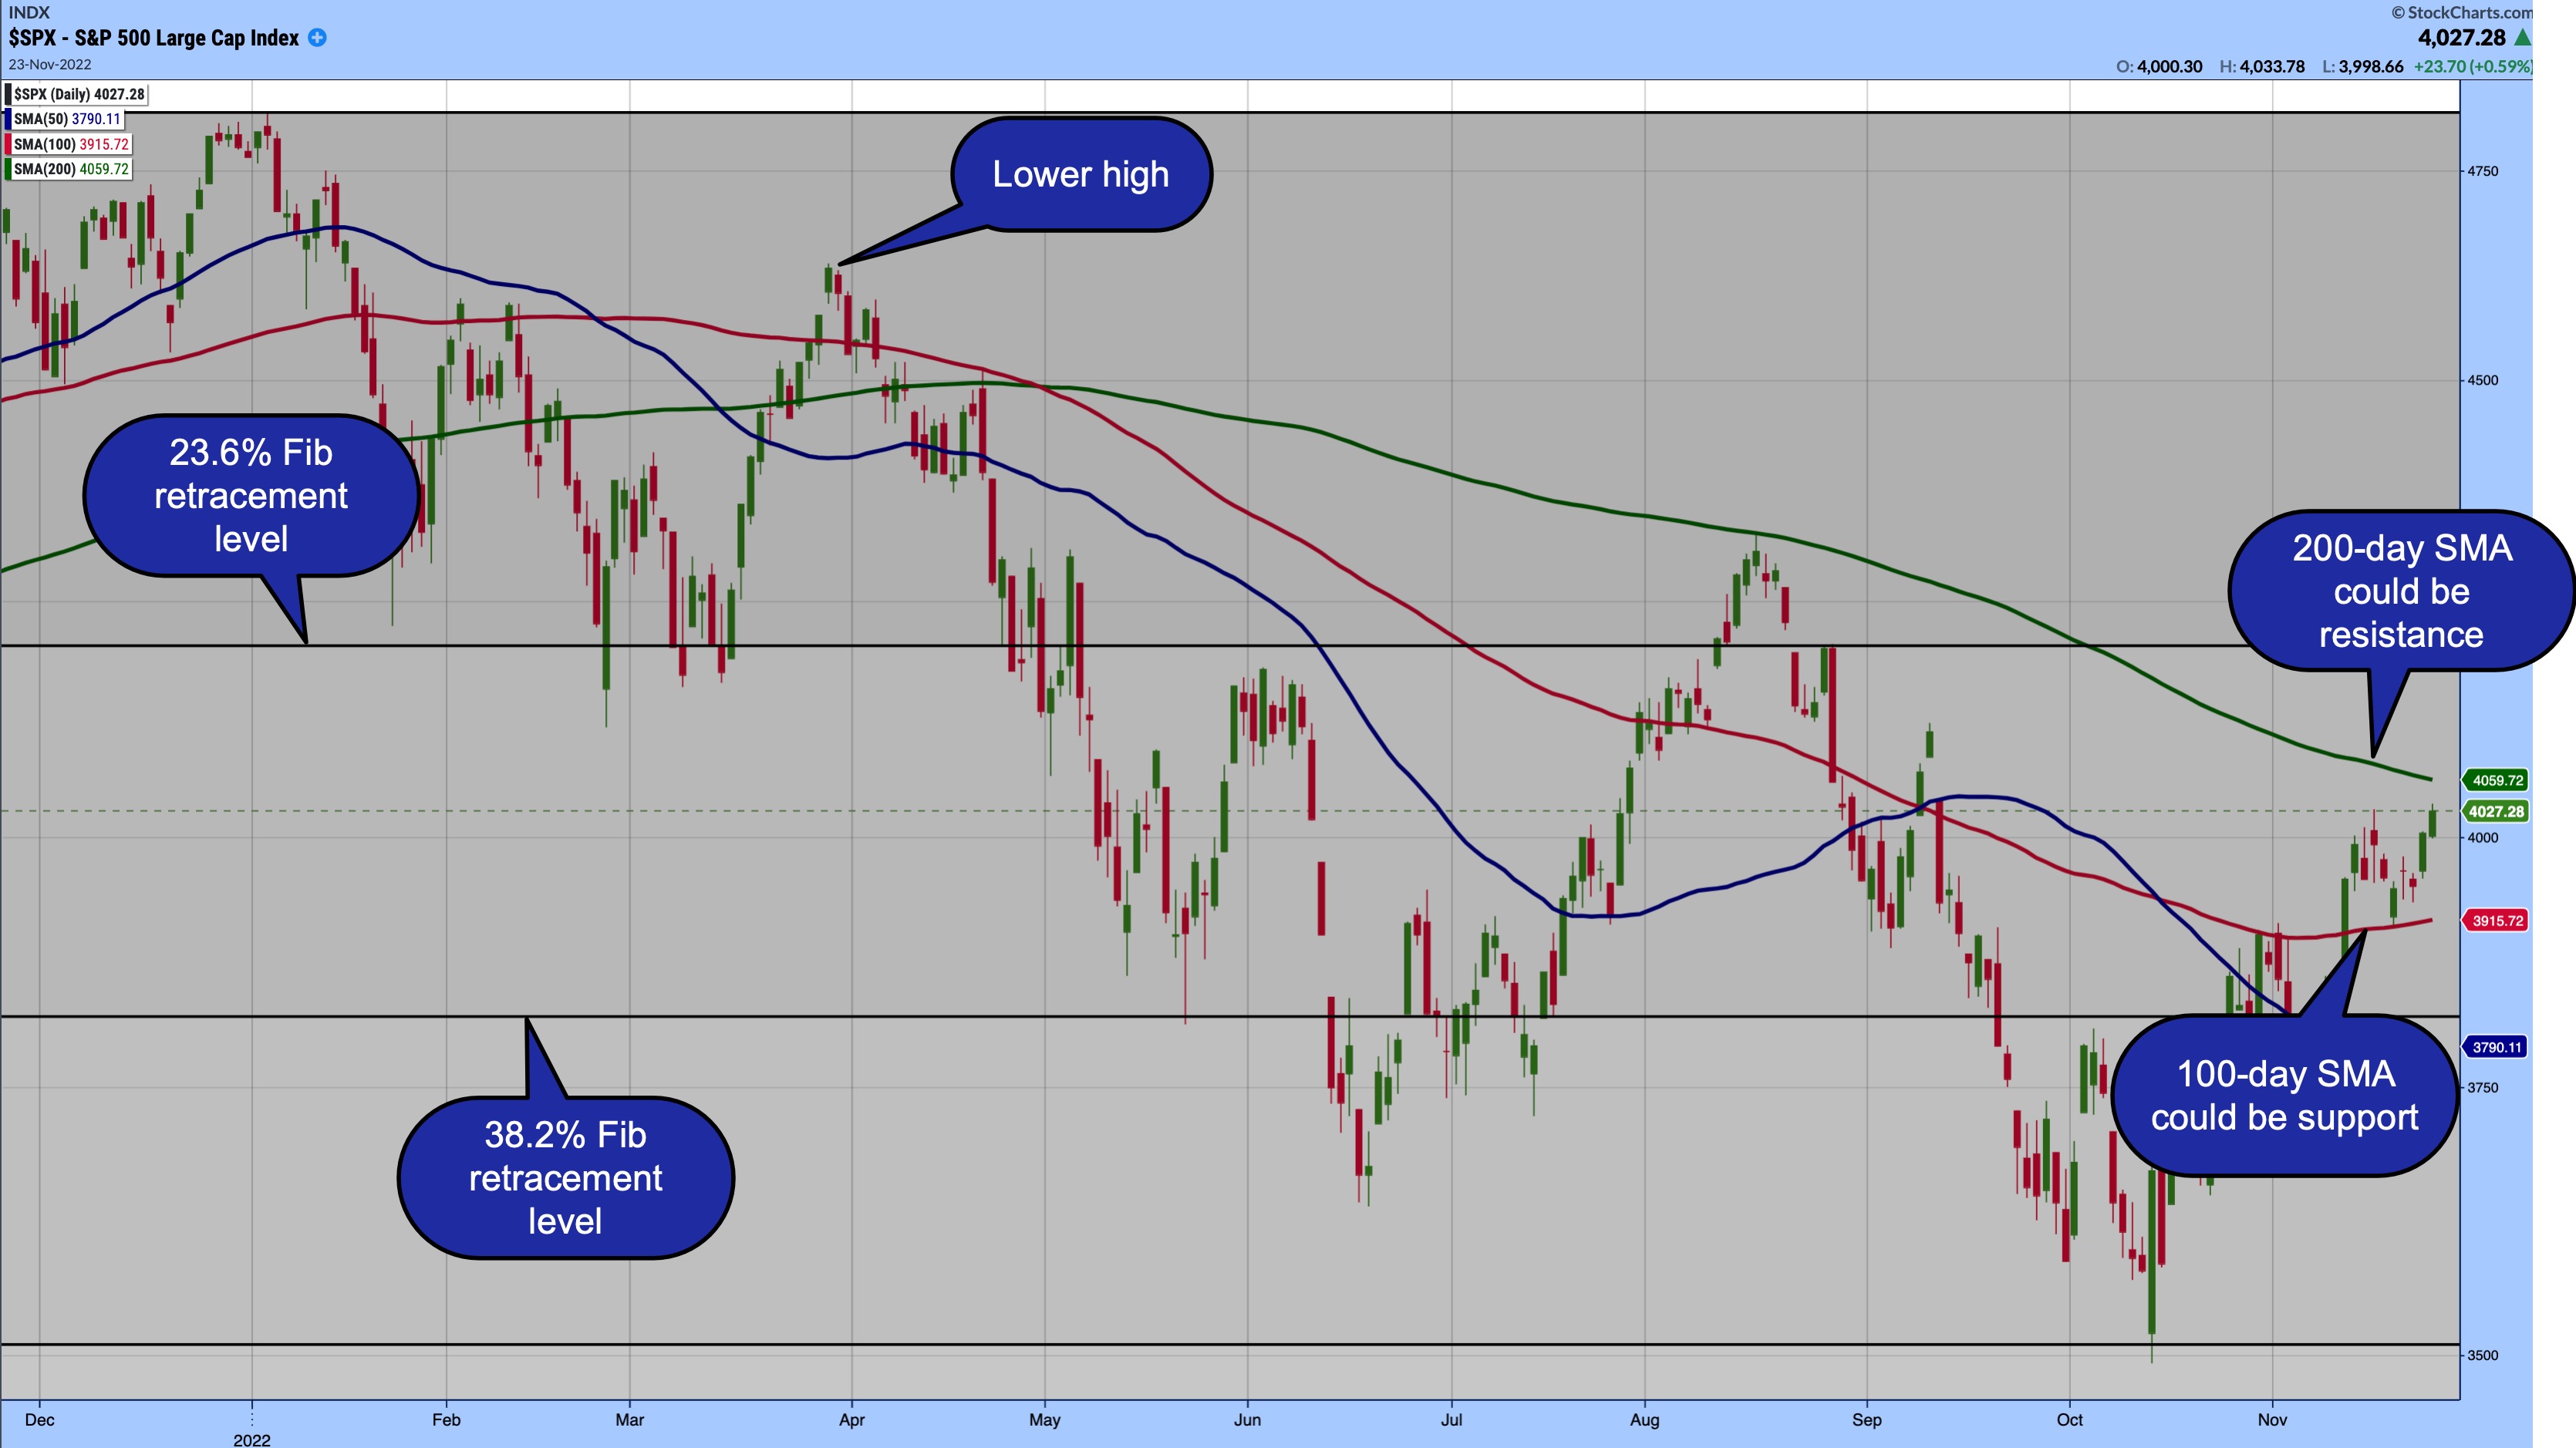
CHART 2: $SPX GETTING CLOSE TO RESISTANCE. The 200-day SMA is one to keep an eye on since it could act as a resistance level. Chart source: StockChartsACP from StockCharts.com
If you’re technically astute, you may have noticed that the March high was lower than the January high. In addition, the 50-day SMA was trending lower, and the 100-day SMA had flattened and was trending slightly lower. These events should have alerted you to the possibility that the markets may be heading lower. In short, that was the time to implement rigid money management strategies.
Since then, $SPX traded lower until October, after which it showed signs of trending higher. The question on every investor’s mind is, “Was the October low the bottom?” Let’s look at what the technical signals are indicating.
- $SPX is approaching its 200-day SMA, which could act as a strong resistance level. Note that it’s still trending down, which means the overarching trend for the $SPX is still down.
- The 200-day SMA was a resistance level for the August high.
- $SPX regained its 4,000 level, which is not necessarily a technical level but it is an important psychological level. $SPX is still a long way from 4,200, the 23.6% retracement level. Before it gets there, the index has a few hurdles to cross. It will have to break above its 200-day SMA with strong momentum, and the three moving averages should indicate a bullish trend.
Turning to the 100-day SMA, you’ll see it’s showing a slight uptrend and moving toward the 200-day SMA. The 100-day SMA could act as a support level if there’s a pullback in $SPX.
Seasonal Levitation
The stock market is showing encouraging signs as we head to the strongest months of this midterm election year. It’s a good start to the holiday season. Let’s hope it holds.
Wishing all our readers a very happy Thanksgiving!

Jayanthi Gopalakrishnan
Director, Site Content
StockCharts.com
Disclaimer: This blog is for educational purposes only and should not be construed as financial advice. The ideas and strategies should never be used without first assessing your own personal and financial situation, or without consulting a financial professional.