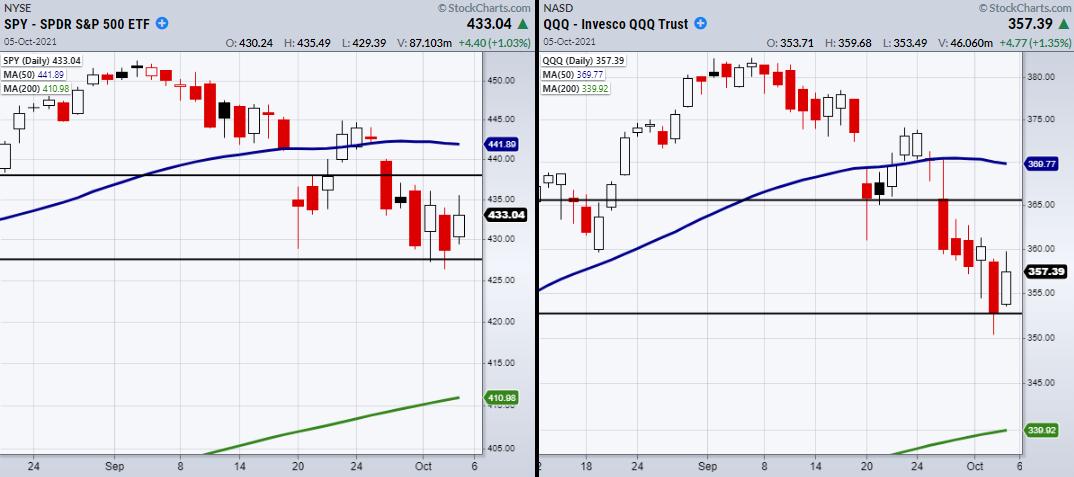
Calendar ranges have been used for a long time in charting as important levels to clear or break down from. Investors can view price as bullish when over the range and bearish when trading under. We like to use the 6-month calendar range, as it shows long-term support or resistance levels to watch.
The most recent range for the S&P 500 (SPY) is created from the first ten trading days of July, giving us a high of $437.92 and a low of $427.52. The Nasdaq 100 (QQQ) has a high of 365.49 and a low of 352.68. With that said, both major indices are holding within the range, showing that we are in a neutral zone.
Now that both indices have bounced off the lows of the calendar range, we can watch for a breakout back over the highs. However, if the lows of Monday and the calendar range break, the next major support area comes from the popular 200-day moving average (Green line).
With a looming debt ceiling on October 18th, we should keep these levels in mind as the market holds its breath on a timely agreement. On the other hand, while the market is worried about a government shutdown, it could easily take a higher note if the debt ceiling is quickly raised.
Follow Mish on Twitter @marketminute for stock picks and more. Follow Mish on Instagram (mishschneider) for daily morning videos. To see updated media clips, click here.
ETF Summary
- S&P 500 (SPY): Support 426.
- Russell 2000 (IWM): Doji day. 225 resistance area. Support 217.
- Dow (DIA): 334.13 next main support area. Needs a close over the 10-DMA at 343.78.
- Nasdaq (QQQ): 352 support area.
- KRE (Regional Banks): 67 support area. 70 resistance.
- SMH (Semiconductors): 247.85 support area.
- IYT (Transportation): 250 resistance.
- IBB (Biotechnology): Watching to hold 155.
- XRT (Retail): 88.74 support the 200-DMA.
Forrest Crist-Ruiz
MarketGauge.com
Assistant Director of Trading Research and Education