SPX Monitoring Purposes: Neutral
Monitoring Purposes GOLD: Long GDX on 10/9/20 at 40.78
Long Term SPX Monitor Purposes: Neutral
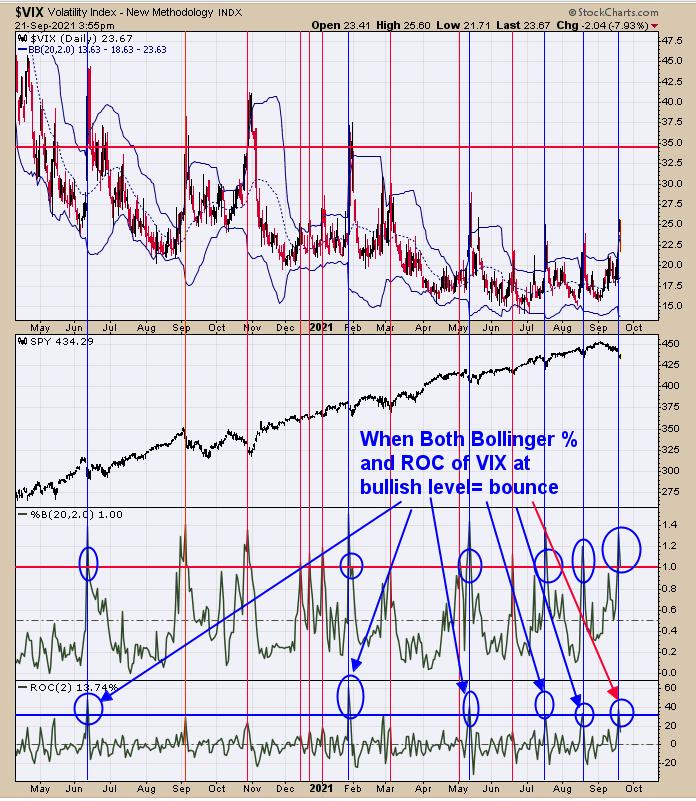
We updated this chart from yesterday, where we said “The bottom window is the ‘Rate of Change’ for the VIX. A reading above 30% change is a bullish sign, and today’s close was 35.90%. Next window up is the ‘Percent Bollinger Band’ and readings above 1.00 have been bullish for the market; today’s close was 1.32. When both indicators are in bullish levels, the market is usually near a low.” We are thinking at the moment that at least yesterday’s low will be tested (4300 SPX) and possibly the July 19 low near 4200. Yesterday’s down gap was tested by SPY on lighter volume today (bearish) but not tested by QQQ and that test may be coming shortly. Staying neutral for now.
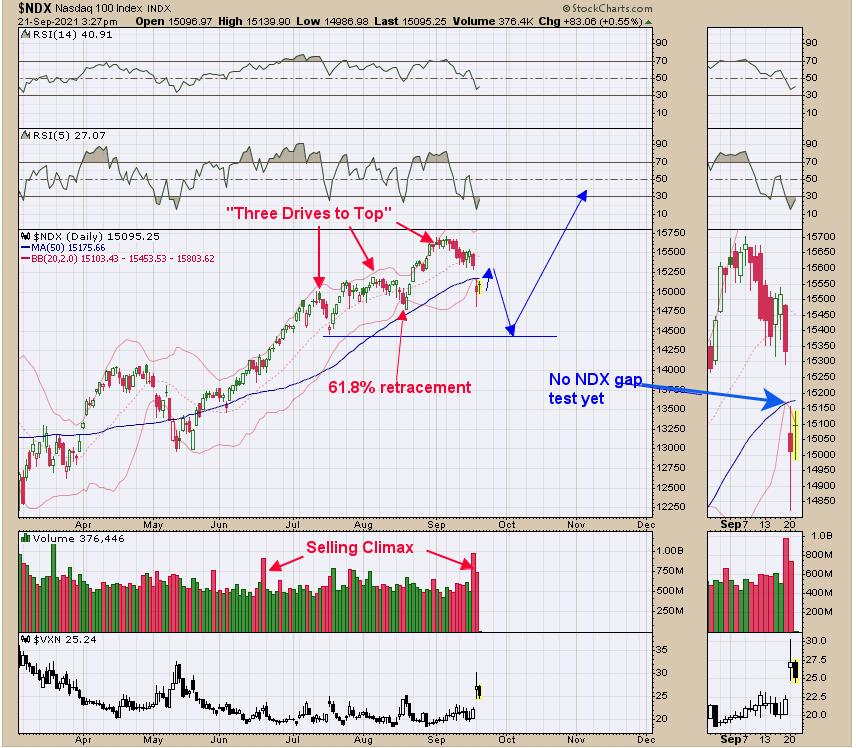
Continuing with the “road map” scenario from yesterday, the pattern that appears to have formed on the NDX is “Three Drives to Top”, which can be identified with a 61.8% or greater retracement down from the second top. This pattern has a downside target to where the pattern began, which in this case come in the near-14500 range. The big down gap yesterday appears to be a “mid-point gap” which also give a target near 14500 range. Yesterday, we said “Market is getting over done short term and could see bounce to test gap level.”
The bounce did come as expected, but NDX has not touched the gap level so far. That may come tomorrow, which is the FOMC meeting. We do expect the gap will provide resistance. We are not sure if the gap will get filled or just tested. We could end up with a sell signal if the TICK and TRIN become euphoric. If NDX triggers a signal, the SPX will follow. Seasonality is bearish into October. Seasonality does have a bullish period for the third week of October which is Options Expiration week; therefore, the bottom may form in mid-October.
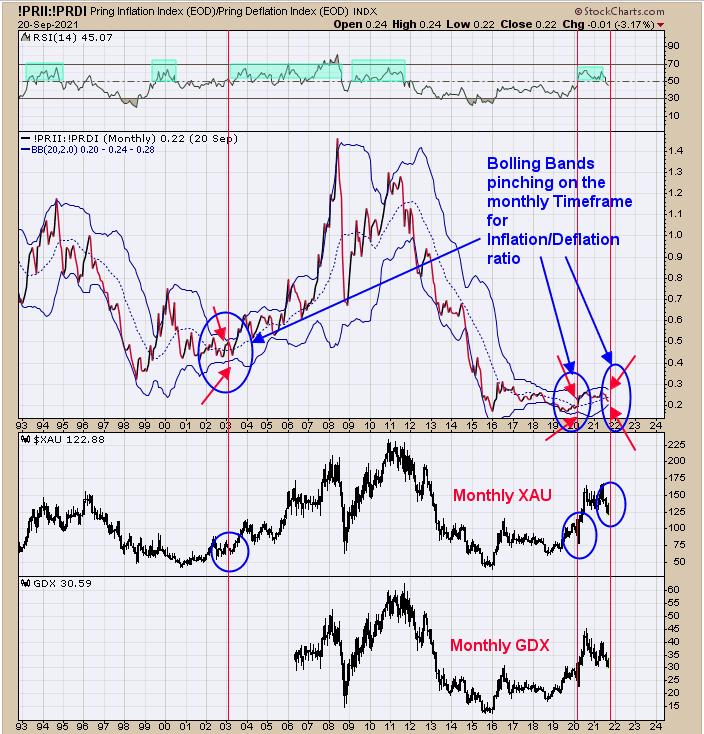
The FOMC meeting starts today and ends Wednesday with the announcement at 2:00 Eastern Time where it’s common for markets to reverse around this timeframe. The above chart supports the idea that a move in the gold market is not far off. Above is the monthly Inflation/Deflation ratio. When the monthly inflation/Deflation ratio Bollinger Bands start to “pinch” a move in the gold index is forthcoming. We marked on the chart above the last two Bollinger Bands pinches and both had dramatic moves. The last one came at the March 2020 low. Not many occurrences but, when it does happen, it’s worth taking note.
Tim Ord,
Editor
www.ord-oracle.com. New Book release “The Secret Science of Price and Volume” by Timothy Ord, buy at www.Amazon.com.