SPX Monitoring Purposes: Sold 10/18/21 at 4486.46= gain 2.81% ;Long SPX on 10/13/21 at 4363.80.
Monitoring Purposes GOLD: Long GDX on 10/9/20 at 40.78.
Long Term SPX Monitor Purposes: Neutral.
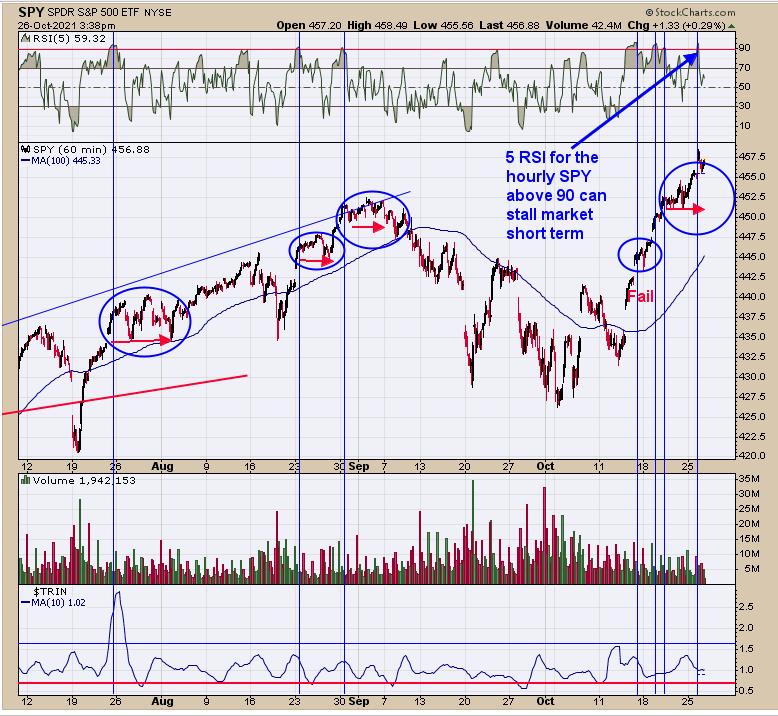
Above is the hourly chart for the SPY. The top window is the 5-period RSI for the hourly SPY. We circled in blue the times when the RSI (5) reached 90. Today, the RSI 5 reached above 90 again, and the last three times that happened over the last couple of days had little effect on the SPY rally. What normally happens is a slight rise before a pullback begins. Maybe the fourth time is the charm. Page two shows additional indicators that suggest a market stall is possible here. We are not bearish here, but a short-term consolidation is possible. If the consolidation does occur, we will look for a bullish setup. A cycle low comes in on Friday. Sold long SPX on 20/18/21 close for a gain of 2.81%.
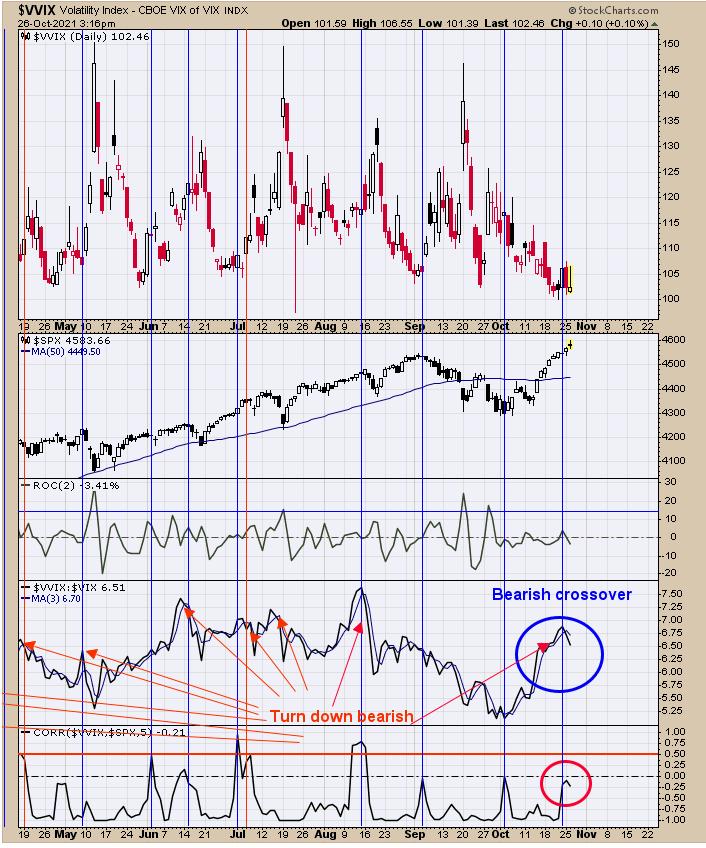
We updated this chart from yesterday. It appears this chart is sending a message that a pullback is likely short term. The bottom window is the correlation for VVIX to SPX. Readings near “0” usually stalls the market; the current reading is -.21. The second window up from the bottom is the VVIX/VIX ratio. When this ratio is rising, the SPX is considered in an uptrend and, when declining, a downtrend. When the VVIX/VIX ratio closes below its 3-day average, it’s a bearish sign (pointed out with red arrows). This bearish crossover happened yesterday and remains on the bearish crossover today. The VVIX/VIX ratio bearish crossover can be early, but usually gives an actuate signal. Two different indicators suggest market could stall in this region. Our view short-term is that the market may flip sideways to down for a few days, after which it will head higher again next week. Could see 4800 SPX or higher before the year is out.
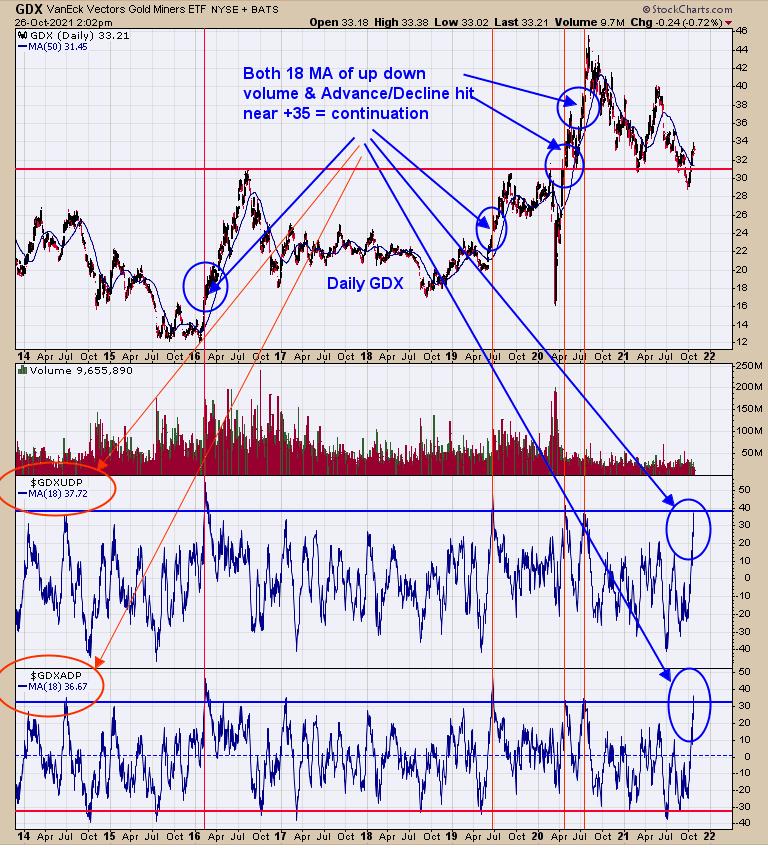
We updated this chart from yesterday, when we said “The bottom window is the 18-day average of the Advance/Decline percent and the next window up is the 18-day average of the Up Down Volume percent. When both indicators reach near +35 (red vertical lines), the GDX rally continues at least another couple of weeks and can go longer. When both indicators extend into the +45 range, the rally can last another month or longer. As of today, both indicators are still below +35 (both near +25 of last night close), so this method has not kicked in yet but something to watch closely in the coming days. Both indicators reaching +35 are like a ‘Sign of Strength’ off a bottom confirming the uptrend.” Both indicators are now in the +35 range as of yesterday’s close (circled in red) and suggest the current rally has further to go, extending to at least another two weeks or longer. So far, so good.
Tim Ord,
Editor
www.ord-oracle.com. New Book release “The Secret Science of Price and Volume” by Timothy Ord, buy at www.Amazon.com.