SPX Monitoring Purposes: Long SPX on 2/6/23 at 4110.98.
Monitoring Purposes GOLD: Long GDX on 10/9/20 at 40.78.
Long Term SPX Monitor Purposes: Neutral.
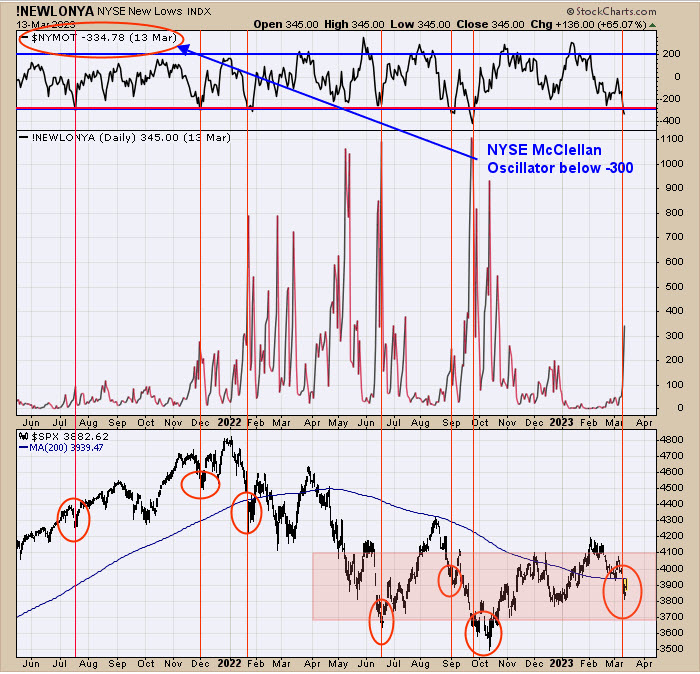
The top window is the NYSE McClellan Oscillator, which dates back to March 2021. We marked the times when the NYSE McClellan Oscillator closed below -300 (yesterday close came in at -335). In all cases, with a -300 or less Oscillator reading marked a least a short term low, and most marked lows that last several weeks or longer. SPY appears to be building a base, as noted in pink-shaded area where Oscillator reached -300 or lower. Page two shows where panic has formed using the TRIN, and both methods have similar appearances.
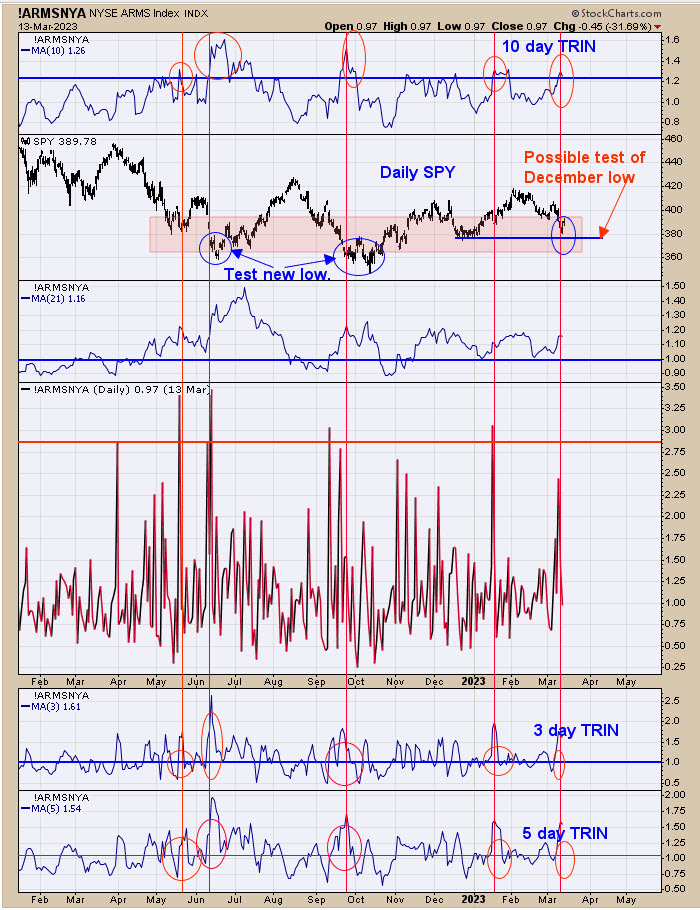
Yesterday, we said, “The bottom window is the 5-day TRIN, the next window higher is the 3-day TRIN, and the top window is the 10-day TRIN. When all three timeframes line up into bullish readings, the market is near an important low. We circle in blue at the June and October lows where the market pushed lower to a new low before reversing. Currently, SPY is not far from the December low and may (or may not) test that level before reversing higher. There is a lot of panic TRIN closes going back to May of last year, which we noted with a pink box. Panic comes at lows in the market, and with panic trin readings dating back to May, it appears a large support area is forming. The SIVB failure last week didn’t help our long position, but did produce panic closes in the TRIN and TICK.” Page one shows where the McClellan Oscillator produced -300, which is noted with a pink-shaded area and rhymes with the TRIN-shaded area. The market appears to be building a base that has a measured target to the 470 SPY range, which is the January 2021 high. We may see some back and forth before a breakout from the shaded area occurs.
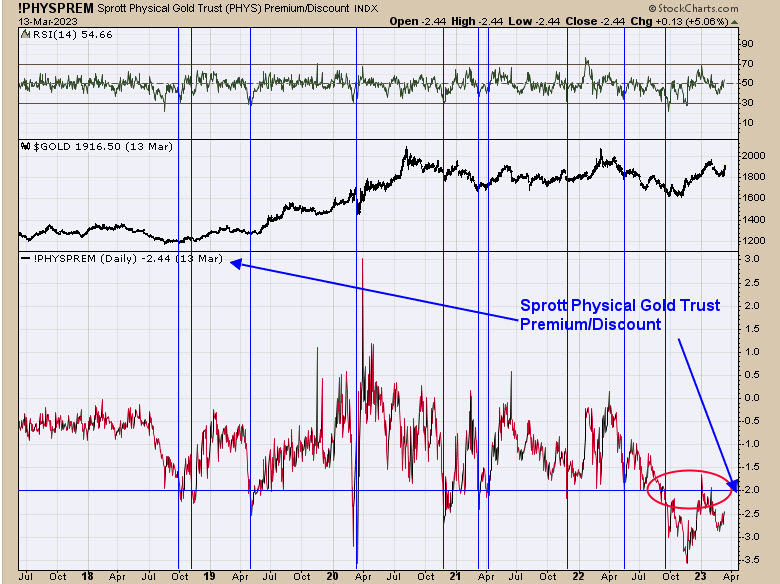
Above is the Sprott Physical Gold Trust Premium/discount index, which shows if you can buy this physical gold above or below the real price of gold. We have this chart going back to 2010. Before 2018, the Sprott Physical Gold Trust Premium/Discount was never below -2% discounts. This Sprott Trust is a sentiment indicator. When investors lean bearish, they can buy this trust below the real price. We marked the times with blue lines the times when Sprott trust was below a 2% discount. As it turns out, every time the discount was below 2%, Gold was near at least a short-term low, and some marked intermediate-term lows. The largest <2% discount going back to 2010 started back in September of last year and is still on going with a 2.44% closing discount yesterday. This long of a discount below 2% is a bullish intermediate sentiment indicator. The current discount below 2% suggests gold is still a good buy at current prices.
Tim Ord,
Editor
www.ord-oracle.com. Book release “The Secret Science of Price and Volume” by Timothy Ord, buy at www.Amazon.com.
Signals are provided as general information only and are not investment recommendations. You are responsible for your own investment decisions. Past performance does not guarantee future performance. Opinions are based on historical research and data believed reliable; there is no guarantee results will be profitable. Not responsible for errors or omissions. I may invest in the vehicles mentioned above.