SPX Monitoring Purposes: Long SPX on 5/31/22 at 4151.09.
Monitoring Purposes GOLD: Long GDX on 10/9/20 at 40.78.
Long Term SPX Monitor Purposes: Neutral.
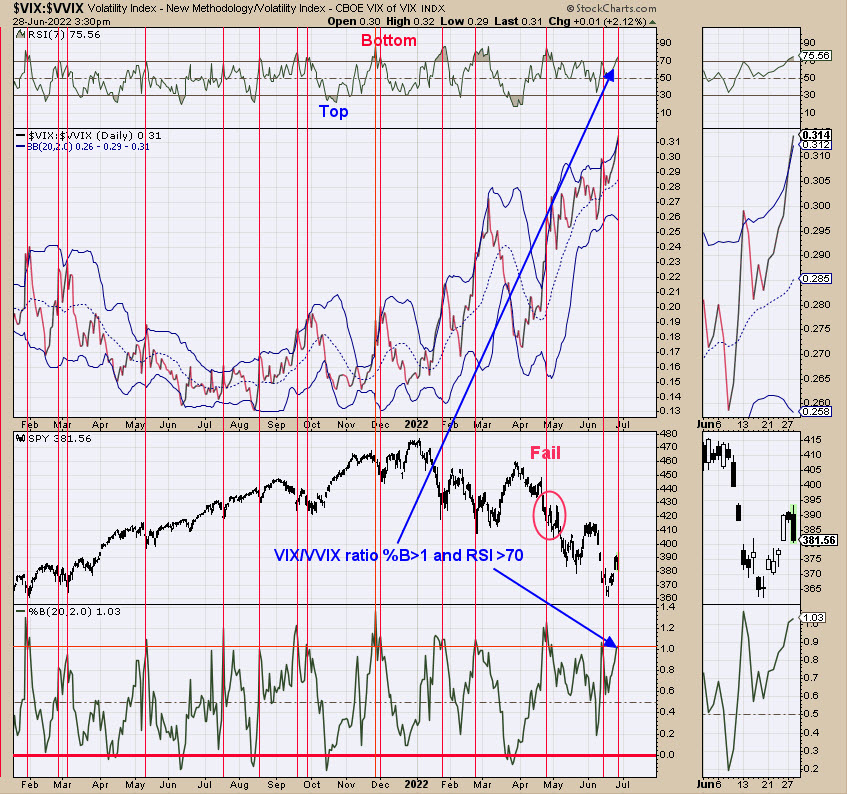
Above is a an indicator that works well for signaling short term reversals. The second window down from the top is the VIX/VVIX ratio. The top window is the RSI for this ratio, while the bottom window is the Percent Bollinger band (an indicator that signals when the upper Bollinger band is reached with a reading >1 and when lower BB is reached with a reading <0). When this ratio moves up fast, it signals that fear is present, which happens when the RSI is above 70 (currently 75.56) and the Upper Bollinger Band is reached and that is when the Percent Bollinger Band >1 (current reading is 1.03). Today’s decline reached Friday’s up gap and tested that gap on lighter volume, which suggests support. The short-term trend on the SPX (SPY) leans bullish.
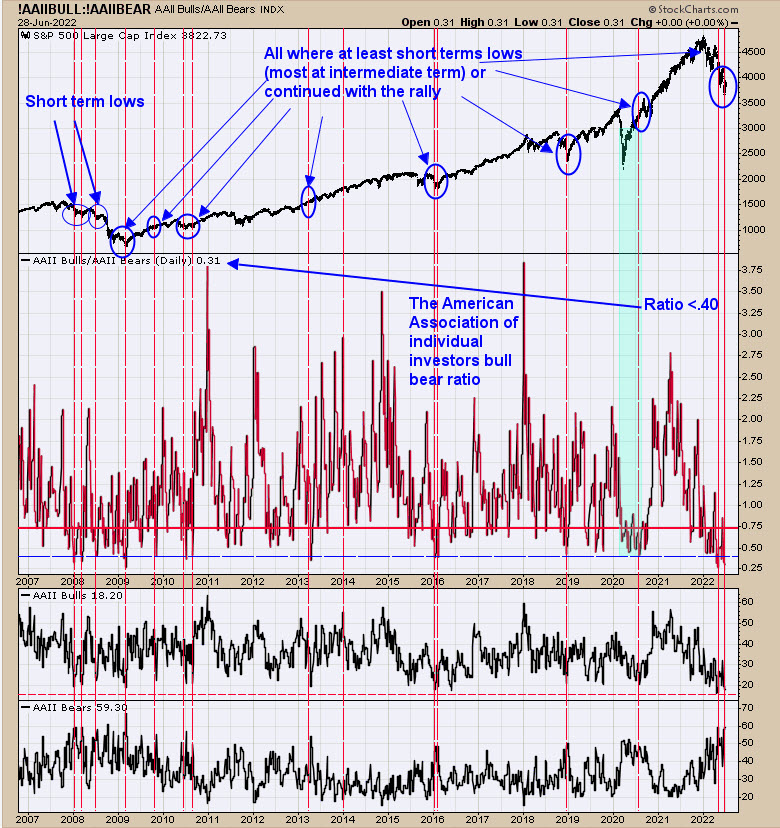
Above is The American Association of Individual Investors Bull Bear Ratio (AAIIBBR). The chart is updated to today and the current reading stands at .31. Readings of .40 and below have at least marked short-term lows, with some marking intermediate-term lows. With the AAIIBBR staying below .40 and in the buy area, the SPY is expected to climb higher in the short term. Today’s pullback tested Friday’s up gap on lighter volume, which suggests Friday’s up gap has support. Don’t think the rally from the mid-June low is over; the 420 SPY range is the next upside resistance.
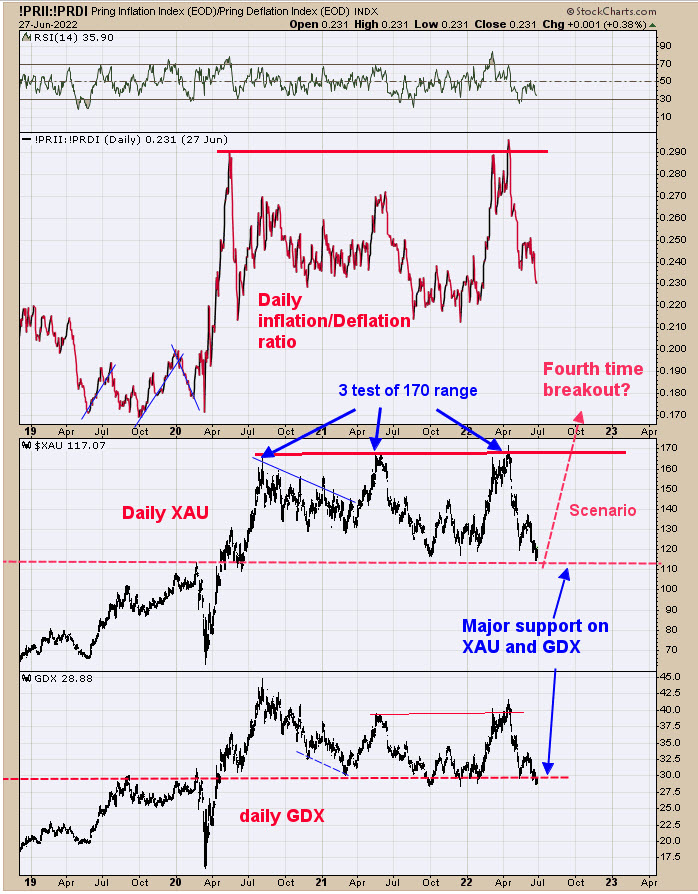
Yesterday and last Thursday, we said, “A rare signal generated on GDX. The last time this type of signal was generated was last October low. The signal is the RSI for the Bullish Percent index for the Gold Miners index. When the RSI for the Bullish Percent index falls below 5 (current reading is 4.40) the market was at an intermediate term low.” This bullish signal lines up at major support for both GDX and XAU (note on chart above). Both XAU and GDX have been in a sideways trading range since August 2020. Its likely the current buy signal will work out and both XAU and GDX will rally back to their resistance, which is 170 on the XAU and the 40 range on GDX. For the XAU, the next time it gets up to resistance near 170 will be the fourth time. The more times an area is tested, the more likely the breakout will occur, so it likely the breakout will come on the fourth test. This sideways trading range for both XAU and GDX has been going on for nearly two years, and a two-year trading range suggests the next rise could last two years.
Tim Ord,
Editor
www.ord-oracle.com. New Book release “The Secret Science of Price and Volume” by Timothy Ord, buy at www.Amazon.com.
Signals are provided as general information only and are not investment recommendations. You are responsible for your own investment decisions. Past performance does not guarantee future performance. Opinions are based on historical research and data believed reliable, there is no guarantee results will be profitable. Not responsible for errors or omissions. I may invest in the vehicles mentioned above.