SPX Monitoring Purposes: Neutral
Monitoring Purposes GOLD: Long GDX on 4/9/20 at 28.96; Sold 5/18/20 at 35.92 = 24% gain.
Long Term Trend SPX Monitor Purposes: Short SPX 5/13/20 at 2820.
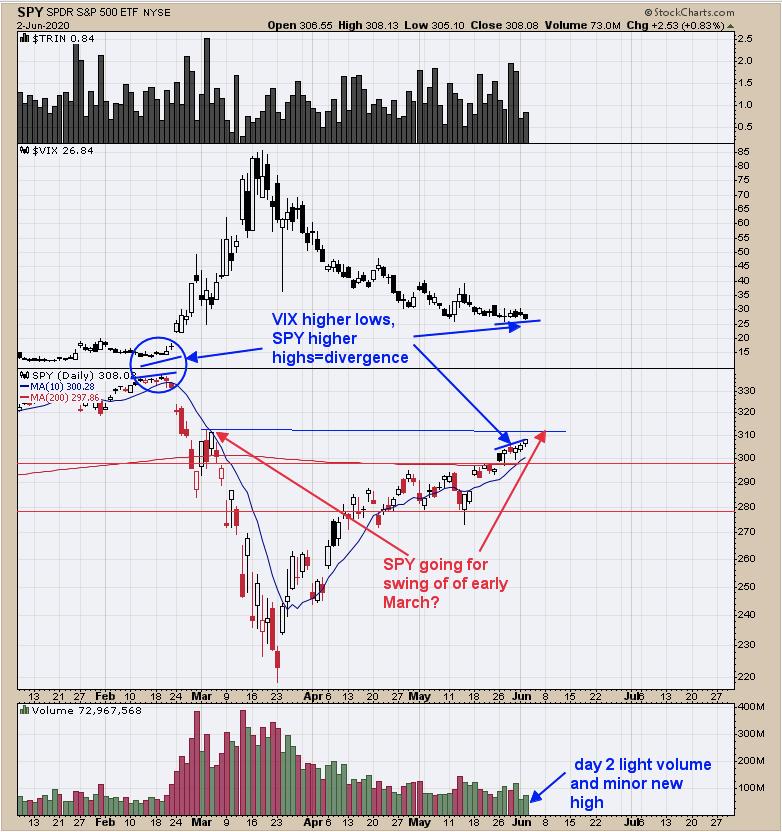
SPY may be going for the early March swing high near 310. The three-day average volume at the early March swing high comes in near 240m; the current 3-day average volume is 83m, about 2/3rds less volume. A test of a previous swing high on 10% lighter volume suggests that swing high will have resistance. The SPY hasn’t tested the early March high yet, but if it does (likely) and volume remains near current levels, that will suggest the 310 level will have resistance. Being patient for now.
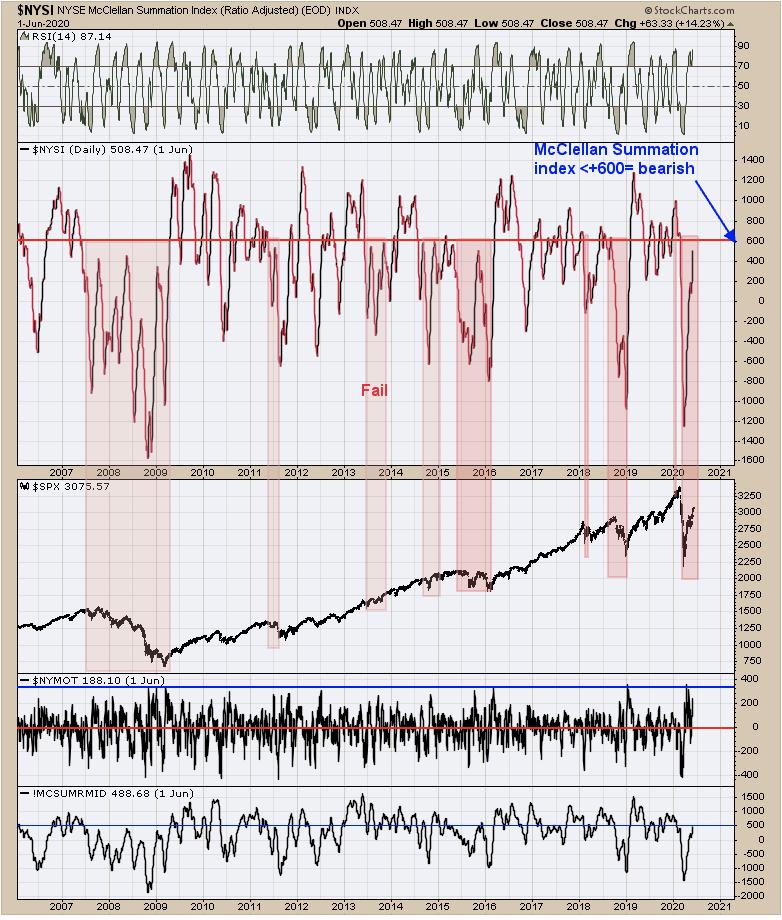
Yesterday, we said “Middle chart is the NYSE McClellan Summation index going back to 2006. It has been a bearish sign for the SPX when the NYSE McClellan Summation index turns down before reaching > +600. The pink-shaded areas are times when the McClellan Summation index turned down before reaching +600. The current Summation index reading is +445 and still rising. If the SPX holds up for the next week or two (or longer) most likely the McClellan Summation index will surpass +600 and a bullish sign for intermediate term. If market trips in the next several days; that could turn down the Summation index before reaching +600 and could lead to an extended decline.” Yesterday, the NYSE McClellan Summation index closed at +508.47; with McClellan Oscillator closing near +230 range, the Summation index will be near +600. If +600 is reached, the odds will say that the March 23 low will not be tested.
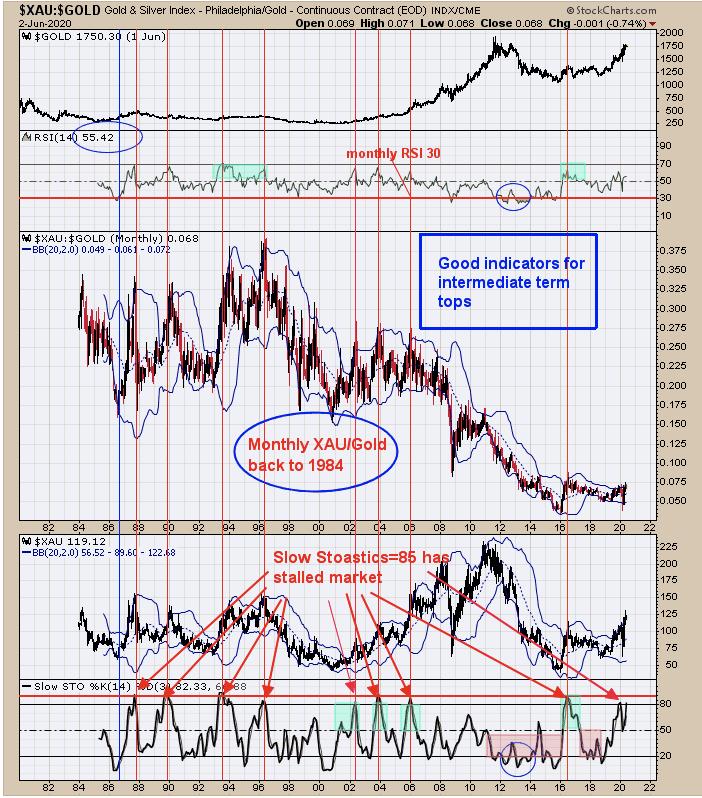
We have been talking about a bullish setup on the next pullback and that the next rally may not last long. The chart above shows why. The chart above is the monthly XAU/Gold ratio and the bottom window is the Slow Stochastic for this ratio. This chart dates back to 1984 and has a long history. When the monthly Slow stochastic for the monthly XAU/Gold ratio reaches near 90, the XAU starts a consolidation that can last several weeks if not several months. The current Slow stochastic stands at 82.33; if the market does bottom short-term and rallies into month-end, most likely the slow stochastic will reach the 90 range. Today, GDX declined and the pullback may have begun, which could lead to a bullish setup. Support comes in near 31.00 range and an ideal place for a bullish setup. Sold long GDX on 5/18/20 at 35.92 = 24% gain. Long GDX on 4/9/20 at 28.96.
Tim Ord,
Editor
www.ord-oracle.com. New Book release “The Secret Science of Price and Volume” by Timothy Ord, buy at www.Amazon.com.