SPX Monitoring Purposes: Long SPX on 5/31/22 at 4151.09.
Monitoring Purposes GOLD: Long GDX on 10/9/20 at 40.78.
Long Term SPX Monitor Purposes: Neutral.
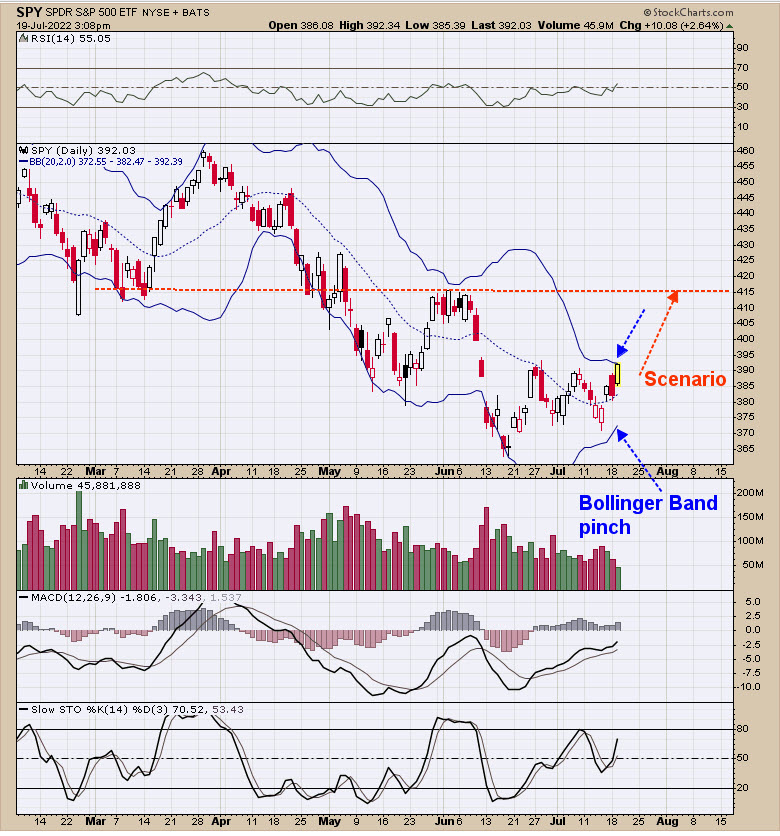
Yesterday, we said, “We have the Bollinger Bands on the SPY chart above; notice that these Bollinger Bands are pinching, which, in turn, suggests a large move is not far off. The Bollinger Bands don’t give the direction of the move, just that a large move is coming. The direction of the move, in our opinion, will be up, in that panic has been present over the last couple of weeks and the McClellan Oscillator is above ‘0’ (closed Friday at +45 and there is a positive A/D line today suggesting a higher McClellan Oscillator today). As long as the McClellan Oscillator remains above 0, the short term trend will be up.” Today, the A/D line was again strong, with a 7/1 advancing-to-declining and with up volume to down volume of near 6/1. This is the type of statistic one wants to see of a potential bottom.

Yesterday, we said, “The top window is the NYSE McClellan Summation index. Intermediate-term lows have confirmed when the Summation index falls below -700 (exhaustion to down side) and then rallies to +1000 in two to three months. The -700 Summation index was reached in mid-May; adding three months would be mid-August for the +1000 Summation index to be reached. My point is that, for an intermediate term low to be confirmed, this current rally would need to continue for the Advance/Decline to continue in a bullish fashion. The TRIN and TICK closes over the last couple of weeks did produce enough panic for the rally to continue.” Yesterday, the A/D line was near 5/1 and today 7/1; Up volume to Down volume yesterday was 4/1 and today 6/1. These types of bullish readings will need to continue for the NYSE Summation index to reach +1000 in the near future; we are thinking this is possible. Side note: the FOMC meeting is July 26-27 and could have a short-term effect on the market.
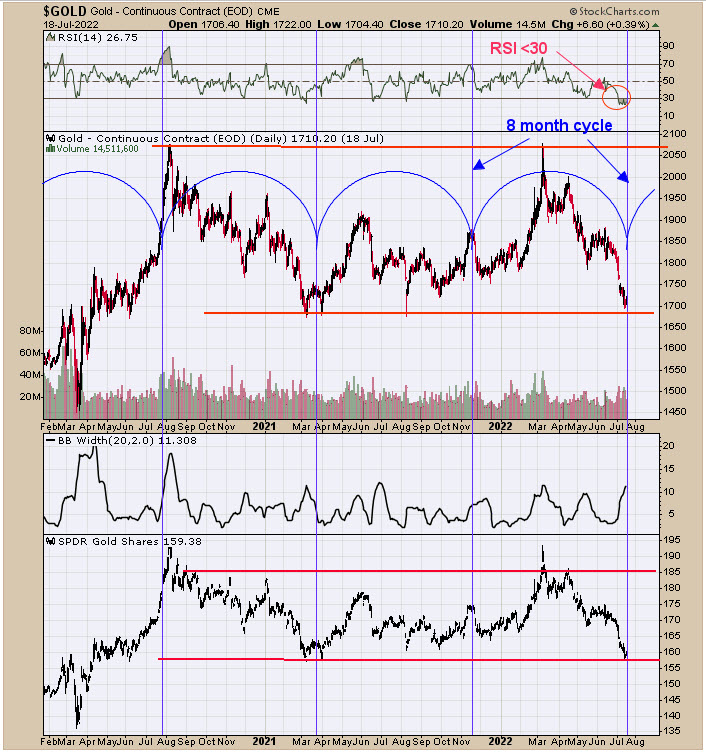
Above is the 8-month cycle for gold. This chart goes back over two years. The next 8-month cycle for gold comes in the next couple of days (noted with a blue vertical line). Notice also that the RSI for Gold is below 30 showing an oversold condition, which is coming on the heals of a test of a previous low. Gold has been trading sideways since mid-2020 building “Cause” for the next breakout. For very short-term, gold appears to be near a low and is due for a rally. With a sideways pattern lasting two years on Gold, a breakout is due. The next time up will be the third time up to test the highs near the 2100 level and the third time could be the charm.
Tim Ord,
Editor
www.ord-oracle.com. New Book release “The Secret Science of Price and Volume” by Timothy Ord, buy at www.Amazon.com.
Signals are provided as general information only and are not investment recommendations. You are responsible for your own investment decisions. Past performance does not guarantee future performance. Opinions are based on historical research and data believed reliable, there is no guarantee results will be profitable. Not responsible for errors or omissions. I may invest in the vehicles mentioned above.