SPX Monitoring Purposes; Sold long SPX on 12/21/20 at 3694.90 = gain 1.3%; long 12/14/20 at 3647.49.
Monitoring Purposes GOLD: Long GDX on 10/9/20 at 40.78.
Long-Term SPX Monitor Purposes: Long SPX on 10/26/20 at 3400.97.
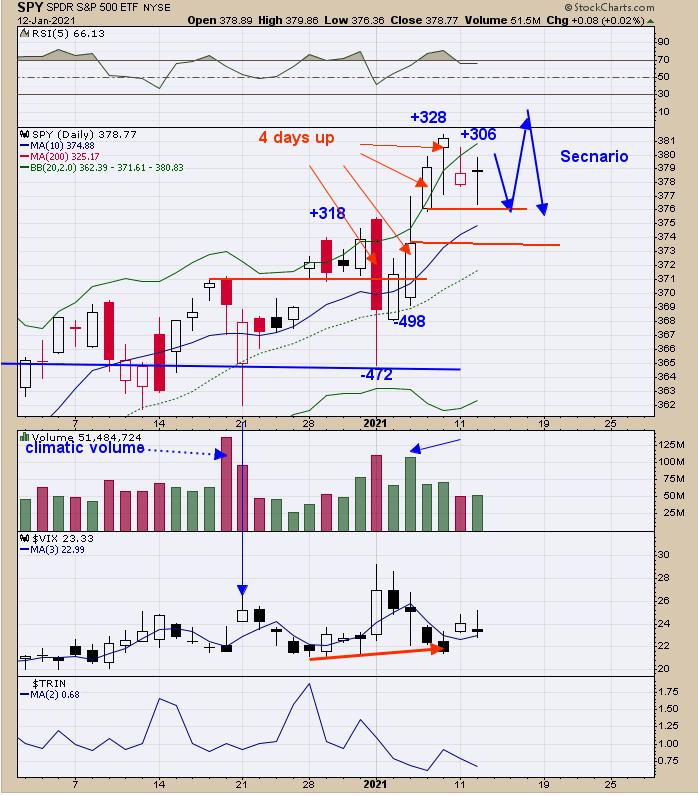
On Friday, we sent out a short note that said. “Today the SPY was up 4 days in a row, which indicates the market will be higher within 5 days 83% of the time. Four days up also suggested market will be down Monday and Tuesday. Today’s TICK closed at +328 suggesting short-term exhaustion.” SPY was just short of touching last Thursday’s gap. Today the TICK closed at +306; the last two times the TICK closed above +300 are marked on the chart above and both times market retraced. We are looking for panic in the TICK and TRIN to create a bullish setup and so far that has not happen. We do expect the market will touch a new high, probably before the week is out, but we don’t have a good setup so far. There are worrisome signs in Margin debt and Gamma Exposure suggesting upside is limited, but so far momentum is still up. Market could be entering into a trading range. We remain short-term neutral and intermediate-term bullish for now.
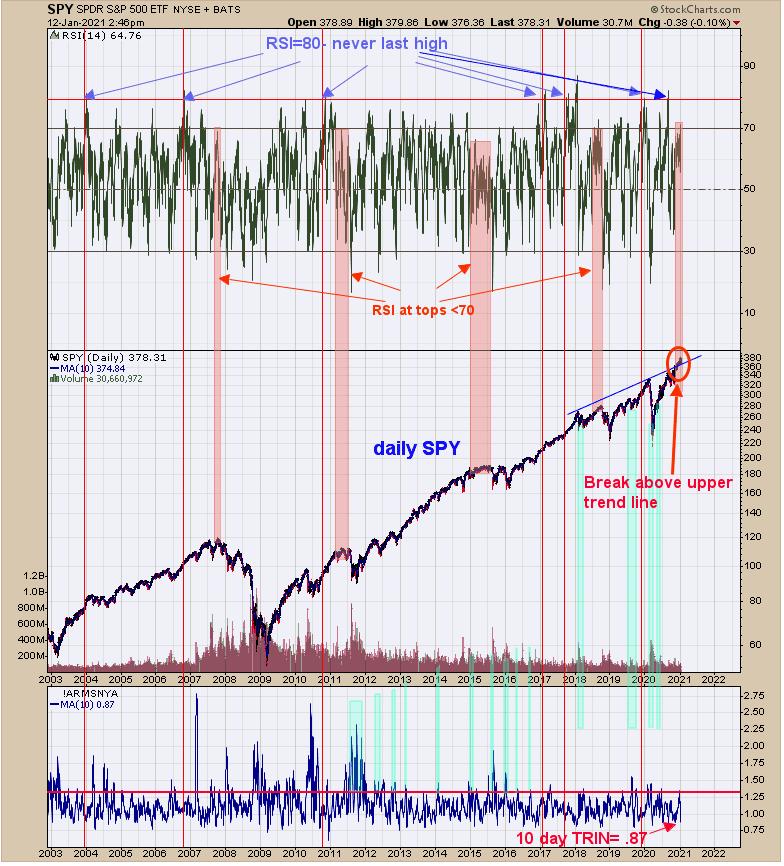
Above is the daily SPY going back to 2003. When the daily RSI for SPY gets near the 80 range, it is never (usually) the last high. When the daily RSI starts to top out around the 70 or lower range, momentum is running out of steam and the market is due for a pullback. We have drawn a trend line connecting the high going back to 2017 and SPY is above that trend line. Two things could happen here: 1) Market goes parabolic above the trend line and RSI rises above 80 showing strength; or 2) SPY falls below trend line, producing a false breakout and market has a retracement. GEX (gamma exposure) reached 22M yesterday (highest-ever reading) and usually puts on the brakes for a market rally over the next 30 days or less. Can see new high here, but GEX this high suggest upside is limited in the coming weeks.
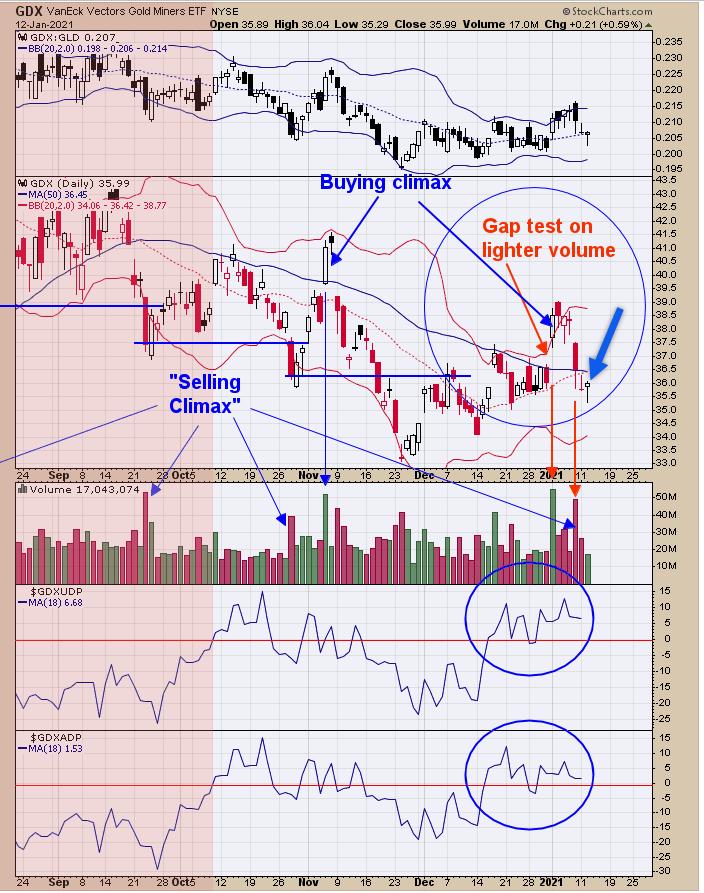
Yesterday, we said “On the volume portion of the GDX chart above, we pointed out the buying and selling climaxes; which were quite a few over the last several months. The last ‘Buying Climax’ came on January 4 and the last ‘Selling Climax’ came January 8. These buying and selling climax usually have a test before the market reverses. The January 4 ‘Buy Climax’ test on January 5 and January 8 ‘Selling Climax’ test appeared today. Also January 4, GDX produced a large gap and most large gaps are tested. If the volume shrinks 10% or more while the gap is tested, that suggests the gap has support and January 4 gap was tested last Friday on 10% lighter volume. Notice today’s light volume test of last Friday’s ‘Selling Climax’ low, which suggests support.” Today GDX produced another attempt to break lower, but volume was lighter than yesterday and Friday showing energy was not there; it then reversed and closed higher (big blue arrow on chart) and a bullish sign.
Tim Ord,
Editor
www.ord-oracle.com. New Book release “The Secret Science of Price and Volume” by Timothy Ord, buy at www.Amazon.com.