SPX Monitoring Purposes: Covered 1/24/22 open 4356.32=7.57%; Short SPX 1/11/22 at 4713.07.
Monitoring Purposes GOLD: Long GDX on 10/9/20 at 40.78.
Long Term SPX Monitor Purposes: Neutral
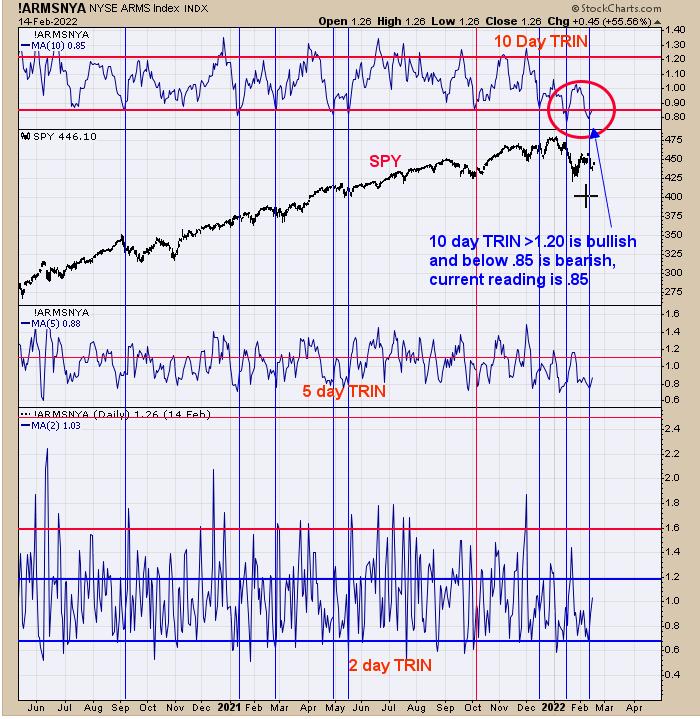
We updated this chart from yesterday, when we said “we are of the opinion that the 1/24/22 low will be tested. For that to happen, the 10-day TRIN should reach above 1.20. The 10-day TRIN currently stands at .83. TRIN closes above 1.20 are where panic forms and panic are what market bottoms are made of. Without panic, there are no bottoms. The 2-day “Rate of Change” (page 2) suggests a short term bounce is near. We will watch how the potential bounce performs and could end up with a short-term sell signal for a target to the 1/24/22 low.” Not much to add here, but 10-day TRIN moved to .85 and is still bearish. Staying neutral for now.
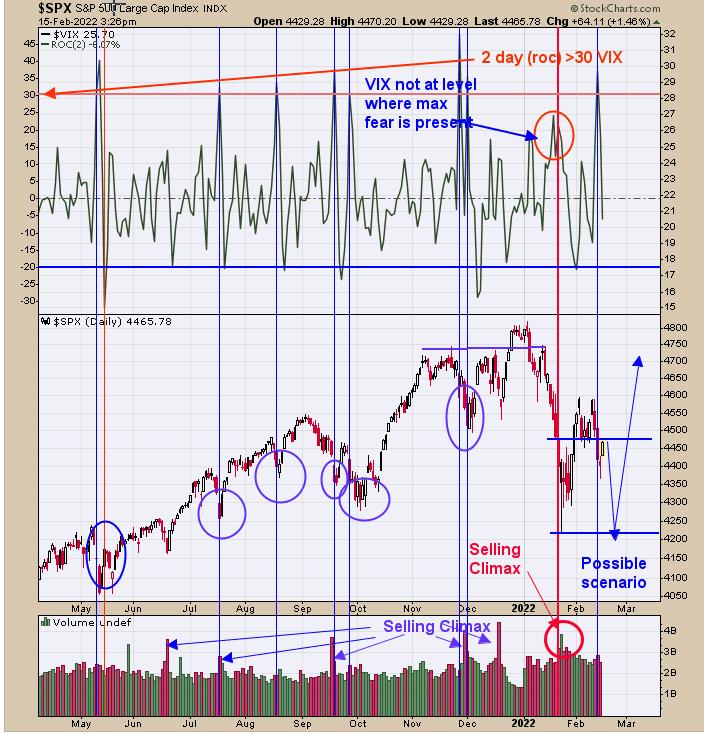
Yesterdayl we said “today’s decline pushed the two-day ‘Rate of Change’ for the VIX above 30, showing VIX going up too fast, which is a sign of panic. The bottom window is the two-period Rate of Change for the VIX. When this indicator reaches above 30, the market is at least near a bounce area.” The 2-period Rate of Change is in the top window and the bounce in the market has started. We don’t think this potential bounce will go far, as there is resistance at the previous lows near the 4500 SPX range. Today’s volume is also relatively light, suggesting upside energy is weak. This is the week of Options Expiration, which has a bullish bias, and the market could hold up this week. We still expect the “Selling Climax” low of 1/24/22 to be tested, but probably not this week; next week is more likely.
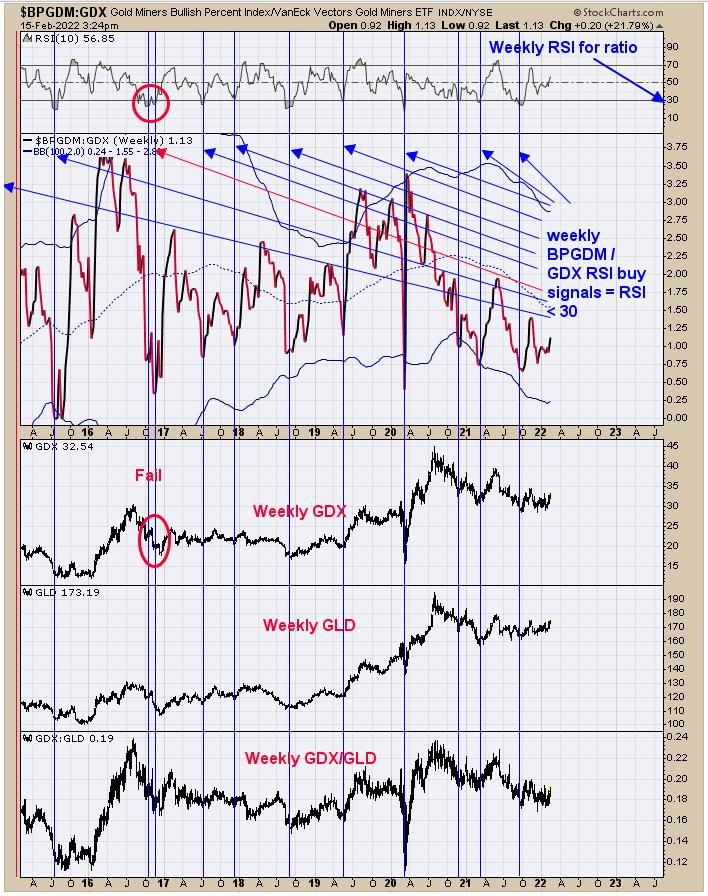
We presented this chart back last September. The chart above is the weekly Bullish Percent index for the Gold Miners index/GDX ratio. The top window is the RSI for this ratio. The Bullish Percent Index measures the percent of stocks in the Gold Miners index that are on Point & Figure buy signals. Bullish signals are generated when this RSI for this ratio drops below 30. The RSI dropped below 30 late September and we pointed that out on our report. Since September, GDX moved sideways but never touched the September low, though it came close in December. Since mid-2015 there have been 10 signals with one failure in late 2016, making a 90% success rate. Most signals lasted several months and some last 6 months or longer. The sideways-to-down consolidation from August 2020 may be ending and a multi-month rally has begun.
Tim Ord,
Editor
www.ord-oracle.com. New Book release “The Secret Science of Price and Volume” by Timothy Ord, buy at www.Amazon.com.