SPX Monitoring Purposes; Long SPX on 3/24/21 at 3889.14.
Monitoring Purposes GOLD: Long GDX on 10/9/20 at 40.78.
Long Term SPX Monitor Purposes: Sold long SPX on 1/15/21 at 3768.25= gain 10.80%; Long SPX on 10/26/20 at 3400.97.
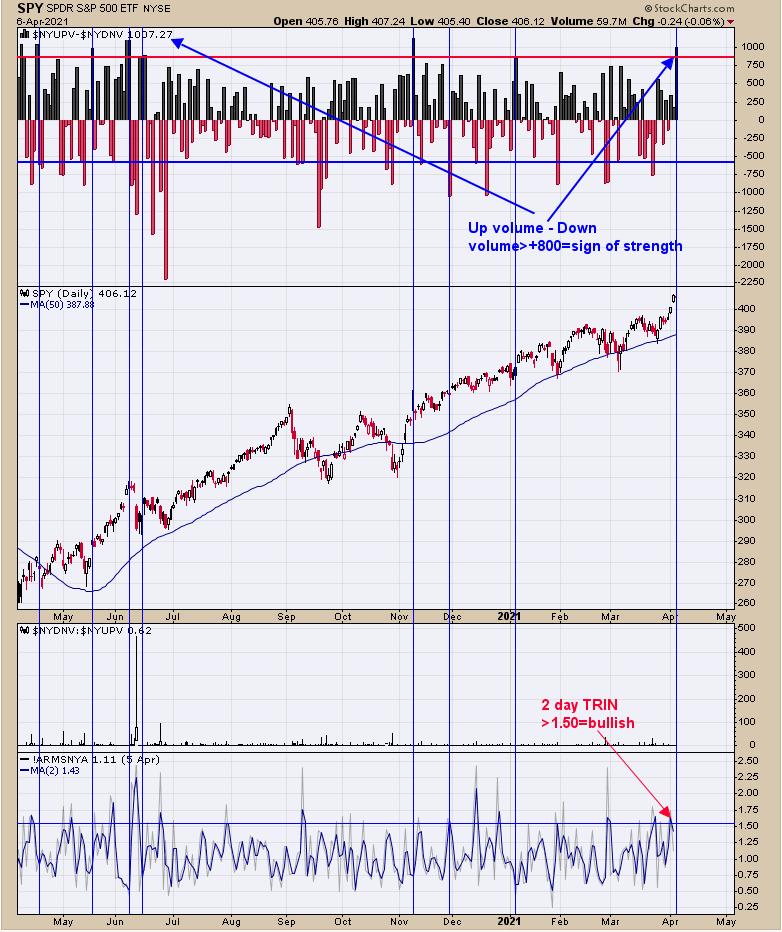
The market is in a strong position. The top window is the NYSE Up Volume minus NYSE Down Volume. Readings above +800 shows the market is in a strong position. There can be minor pullbacks when this high of a reading is recorded, but, after the pullback, higher highs are expected. The bottom window is the two-day TRIN. Two-day TRIN above 1.50 shows there is panic in the market, and panic forms at bottoms and fuels the next rally. Last Friday, the two-day TRIN closed at 1.63. Long SPX on 3/24/21 at 3889.14.
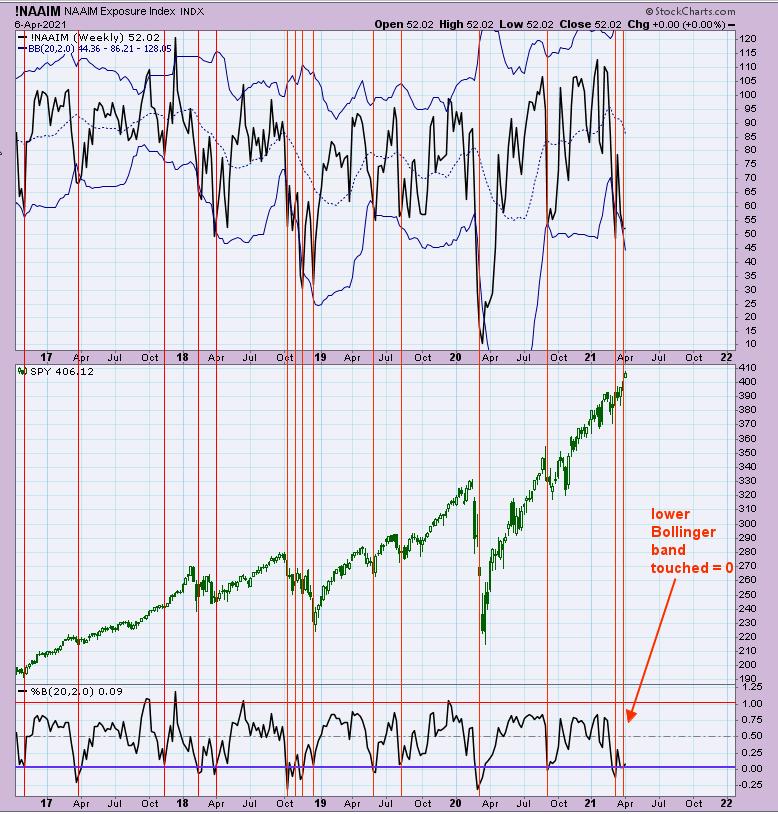
Yesterday, we posted a similar chart to the one above, but this chart paints a clearer picture, as the lower window shows when the lower Bollinger Band is being touched when it reaches “0” or below. We said yesterday, “The top window is the National Association of Active Investment Mangers (NAAIM) with Bollinger Bands. Worthwhile lows have formed in the SPX when the NAAIM touched its lower Bollinger Band. This chart goes back to mid-2016 and the red lines show when the NAAIM touched its lower Bollinger Band. A touch did occur last week, suggesting an intermediate-term low was near. Previous signals have lasted several months. This is a sentiment indicator and the mood is set for an extended rally.”
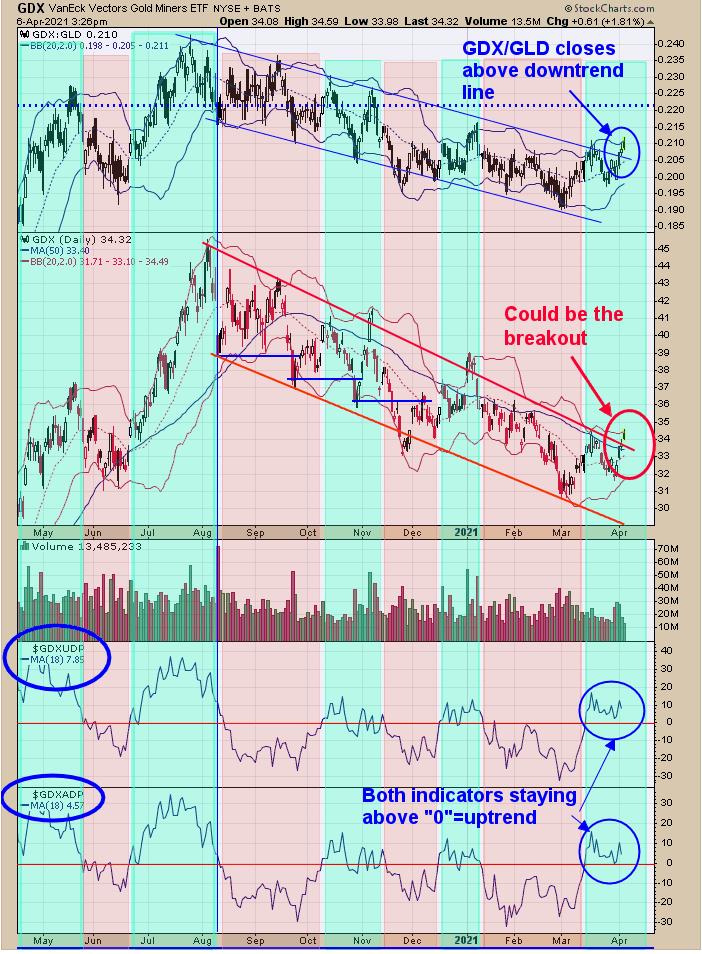
We updated this chart from yesterday, when we said “The colorfully chart above is GDX (middle window) along with GDX/GLD (top window). The bottom two indicators are 18-day average of the Advance/Decline and the next window up is the 18 day average of the Up Down volume. The light blue sections show when both indicators are above “0” and the light pink show when there are below “0”. When above “0” is where the market is trending higher and, as long as both stay above “0”, the trend should continue higher. As you can see, both indicators are above “0” suggesting the short-term trend up. The top window is the GDX/GLD ratio, which a lot of the time leads GDX, and it appears it has closed above its downtrend line going back to the August high, suggesting a breakout. Evidence is coming in that the early March low was the bottom.” Today’s GDX trading closed above its downtrend line, suggesting a breakout as GDX/GLD breakout suggested yesterday. Long GDX (10/9/20 at 40.78).
Tim Ord,
Editor
www.ord-oracle.com. New Book release “The Secret Science of Price and Volume” by Timothy Ord, buy at www.Amazon.com.