The S&P 500 posted its worst week since February, with every sector ending in the red. The move points to investor concerns about volatility as we head into the typically difficult fall period.
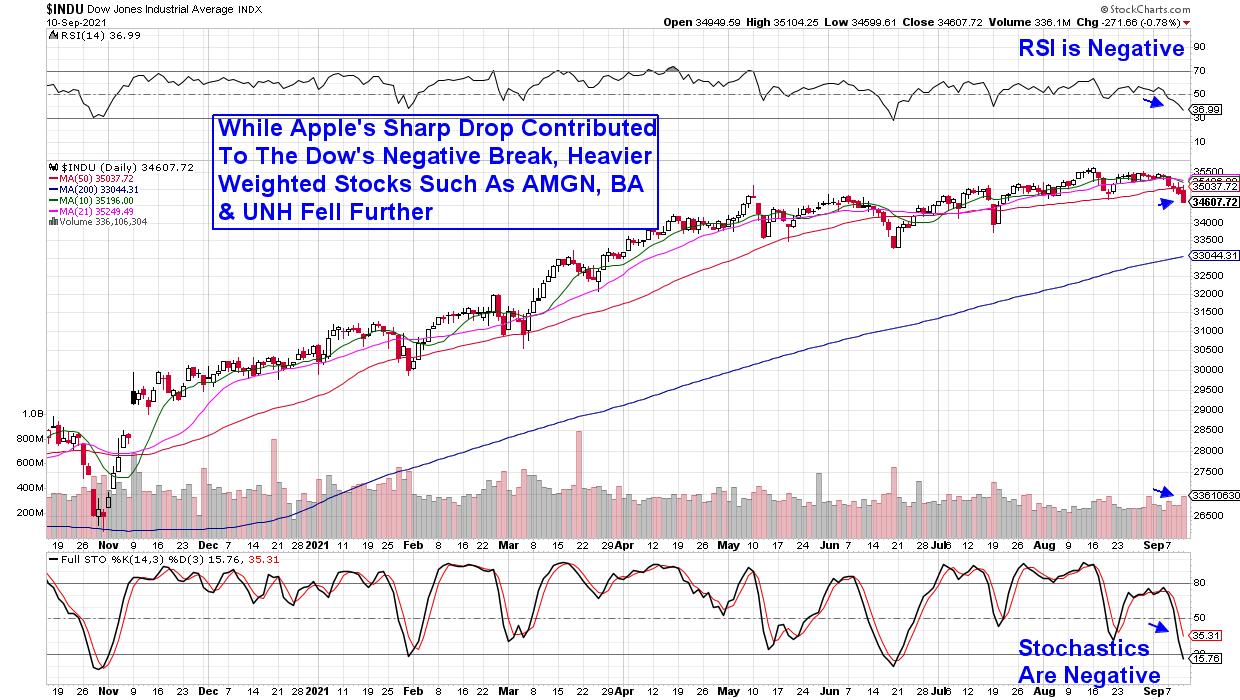
While subscribers to my MEM Edge Report will attest to clear-cut pockets of strength, as most of our buy candidates have more than outpaced the S&P’s decline of 1.4% for the month, the continued narrowing of leadership areas is concerning. Last week’s negative price action in the Dow Jones Industrial Average is also worth noting, as it closed the week below its key 50-day moving average.
DAILY CHART OF DOW JONES INDUSTRIAL AVERAGE

While the longer-term uptrend for the markets remains in place, having a game plan to buffer against any further potential weakness would be prudent at this juncture.
To begin, you’ll want to pay close attention to those down days in the market. If you see a decline of more than 0.2 in the Nasdaq or S&P 500 in higher volume than the previous session, it qualifies as a distribution day.* And if those distribution days cluster together with 4 or 5 over several weeks, this most likely signals that stocks have topped and are heading for a downturn.
After today’s drop in volume, the Nasdaq has a count of 1 distribution day over the past several weeks, while the S&P 500 did not see high enough volume today to qualify, which keeps its count a zero.
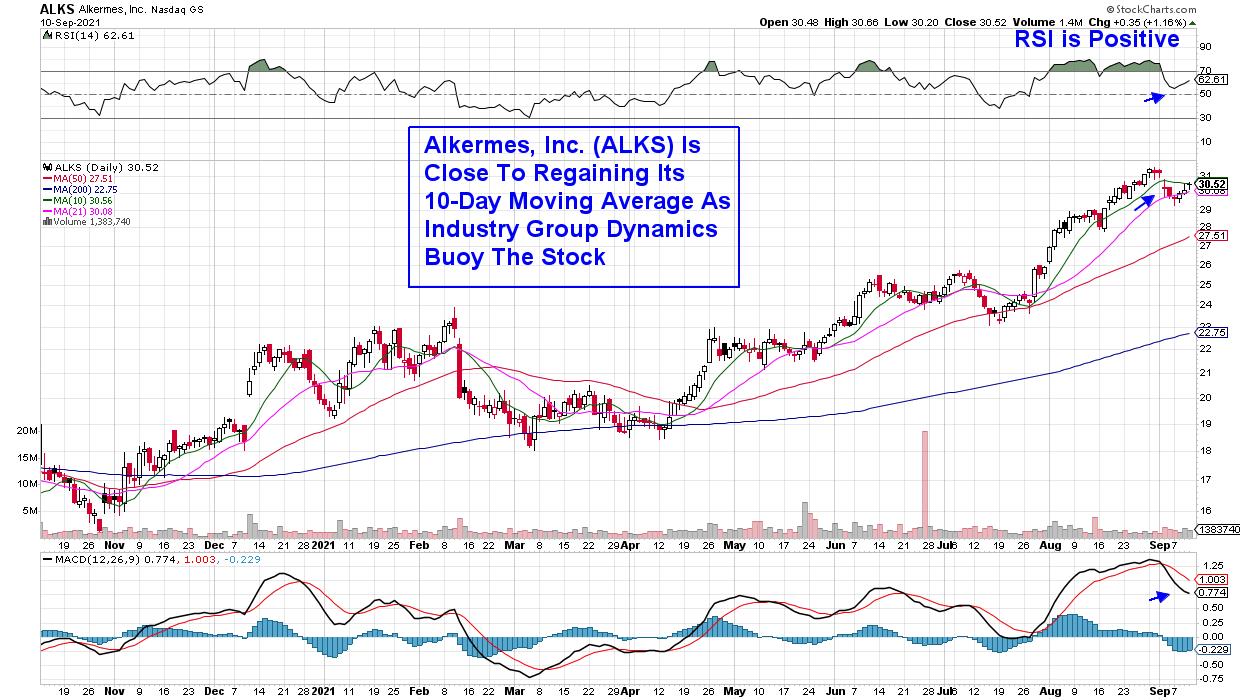
DAILY CHART OF ALKERMES, INC. (ALKS)

As for individual stocks, shorter-term investors may want to take profits if your stock breaks below near-term support such as its 10-day moving average. Given the recovery we’ve seen in most pullbacks this year, however, be prepared to buy that stock back if it breaks back above its 10-day mav and it’s a leadership name.
Alkermes Plc (ALKS), which is a suggested holding from my MEM Edge Report, is a prime example, as its recent break below its 10-day moving average is close to recovering its uptrend. Other stocks such as Crowdstrike (CRWD), which hit a new high in late August, are continuing to drift lower after breaking below their 10-day moving average. One difference here is that CRWD’s break was on above-average volume, while ALKS was not. In addition, CRWD’s RSI and MACD are deteriorating from weaker levels than ALKS.
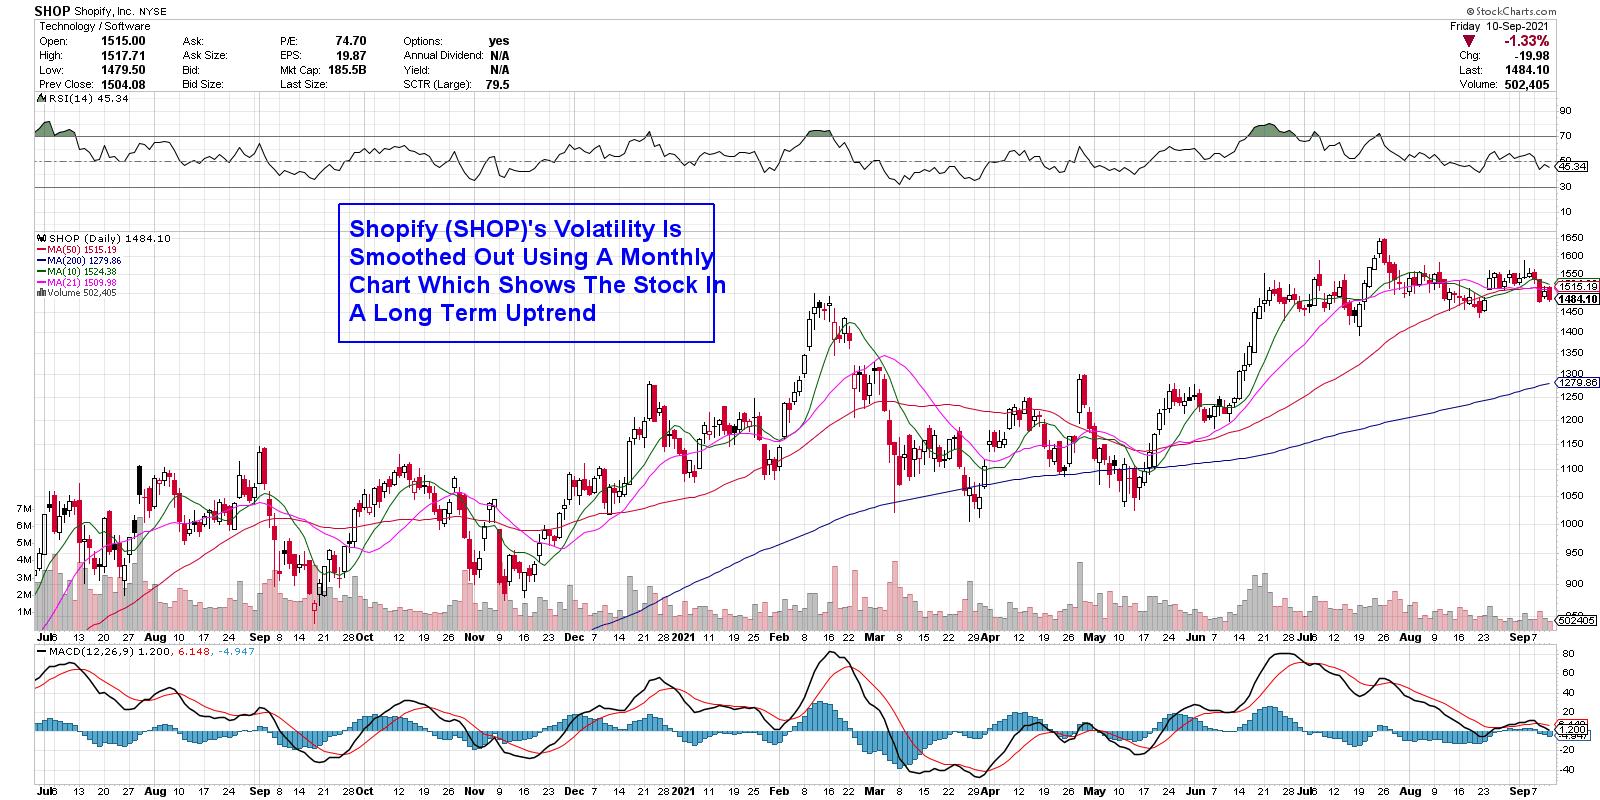
DAILY CHART OF SHOPIFY (SHOP)

Longer-term investors can use a monthly chart, which would keep you in stocks as long as they’re finding support above their 6-month moving average. This approach would keep you in names such as Shopify (SHOP), which has managed to gain 31% year to date despite its highly volatile performance, which you can see above.
While the markets may be heading into a period of increased volatility, keeping your leadership names that exhibit high growth prospects throughout that period will generally serve you well. One key component to this strategy is that the Industry Group that your stock is a part of remains in favor. There are plenty of fast-growing Solar stocks, for instance, but negative group dynamics are holding them down.
For those who’d like to stay on top of the broader markets as well as Industry Group and Sector strength, trial my bi-weekly MEM Edge Report for a nominal fee. You’ll have immediate access to my most recent reports which highlight a select group of leadership stocks that each remain in uptrends.
In addition, I’ll be a guest on this week’s Investing With IBD podcast on Wednesday, September 16th. We’ll be discussing the current market dynamics as well as ways to incorporate winning habits of professional money managers.
For those who can’t make the live broadcast, you can use this link above to be sent to the recording!
In this week’s episode of StockCharts TV’s The MEM Edge, I review last week’s market action to determine whether we’re in for rougher times ahead. I also highlight how to tell if your stock is pulling back or poised to head much lower.
Warmly,
Mary Ellen McGonagle