The current chart of Walt Disney Co. (DIS) provides a perfect case study on how the Relative Strength Index (RSI) can be used to better understand the underlying trend in a stock.
Disney rallied off its March 2020 low along with most other names, but the real outperformance began in November 2020. That’s where we see the stock gapping higher on earnings releases, as it became clear at the Disney+ streaming service would more than compensate for the COVID-19 impact on their theme parks.
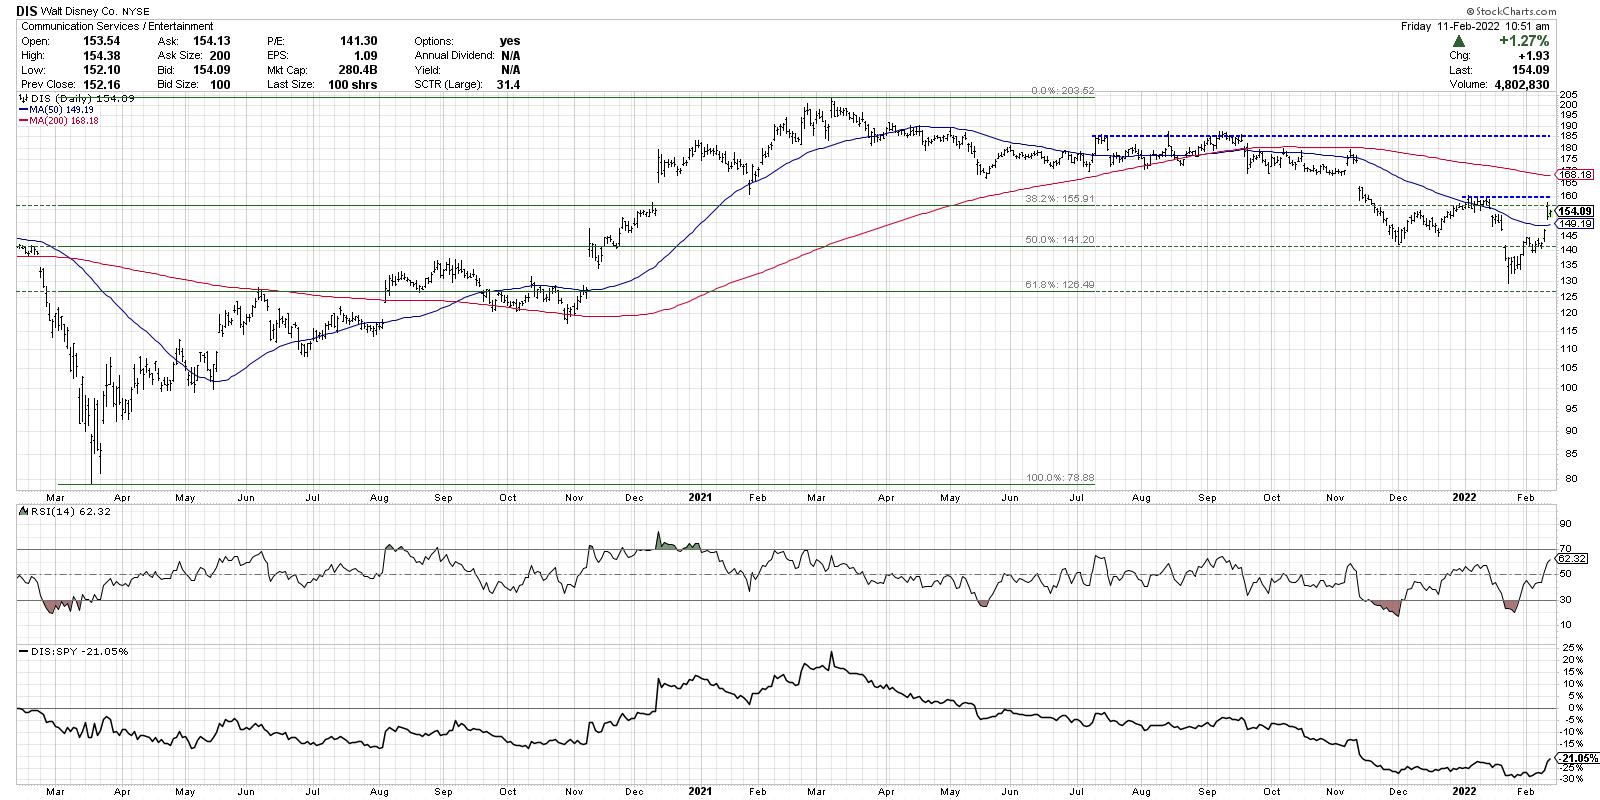
After topping out just above $200 in March 2021, the stock dropped about 18% before settling into a range between $160 and $185.
Look at the RSI indicator and how it behaved during the first half of this chart. The indicator tended to become overbought on rallies and also tended to bottom out around 40 on market pullbacks. Now look at the RSI indicator in the next section, from March 2020 through the present. See how the RSI now tends to become oversold on pullbacks and usually tops out around 60?
Discovering Connie Brown’s work on adjusting the overbought/oversold ranges on oscillators was a key moment for me early on in my technical analysis career. What a fantastic improvement on the original work by Welles Wilder, which allows us to use the RSI as a way of not just identifying short-term reversals, but also defining the longer-term trend.
Note: both books are on my recommended reading list here!
This week, Disney gapped higher after earnings as they indicated that the theme parks business was improving and that Disney+ remains in growth mode. So what would we need to see on the chart to confirm a rotation from bearish trend to bullish trend?
First, DIS would need to break above its most recent swing high around $160. That would indicate that enough buying power has emerged to overwhelm the selling pressure that has been prevalent for months on this chart. Next, I’d want to see the RSI break above 60, which would put the RSI in a more classic bullish range. There have been numerous price bounces over the last six months, but none of them have been able to make new swing highs with the RSI breaking above 60. Lastly, a higher low would be the final confirmation of a rotation from bear trend to bull trend. That would suggest that buyers are willing to buy on the dips and buy at a higher level than previously seen.
How can we apply this lesson to the S&P 500 chart?
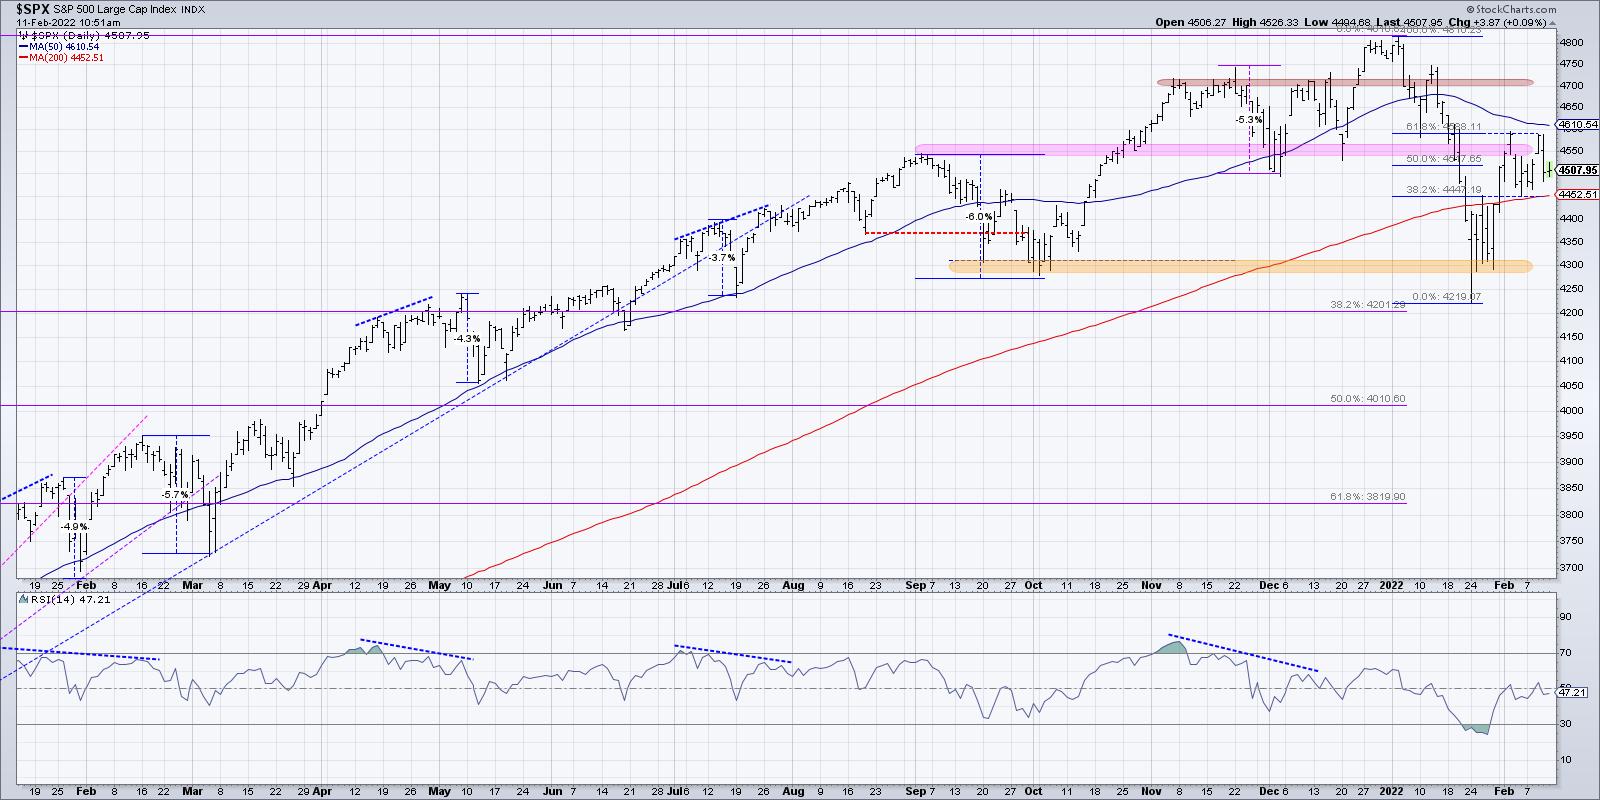
The last time the RSI was overbought was in early November, when the S&P first reached 4700. Subsequent up thrusts in December and January saw the RSI fail to reach much above that crucial 60 level. Also note the bearish momentum divergence, with higher highs in price into January while the RSI was making lower peaks!
The bullishness of the move higher this week has to be questioned when the RSI fails to reach above 60. As long as the RSI remains below 60, and the S&P fails to break above previous swing highs around 4600, this is a chart in distribution mode.
Want to digest this article in video format? Head over to my YouTube channel!
RR#6,
Dave
David Keller, CMT
Chief Market Strategist
StockCharts.com
Disclaimer: This blog is for educational purposes only and should not be construed as financial advice. The ideas and strategies should never be used without first assessing your own personal and financial situation, or without consulting a financial professional.
The author does not have a position in mentioned securities at the time of publication. Any opinions expressed herein are solely those of the author, and do not in any way represent the views or opinions of any other person or entity.