A brief excerpt:
In a 2005 post, I included a graph of household mortgage debt as a percent of GDP. Several readers asked if I could update the graph.
…
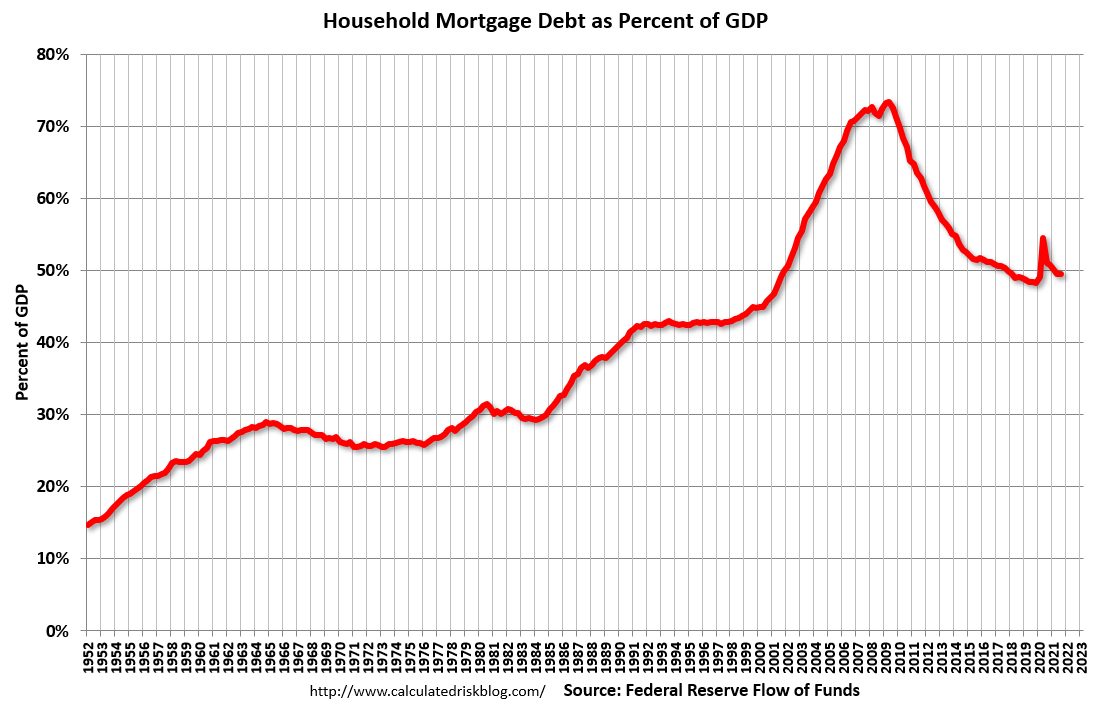
The second graph shows household mortgage debt as a percent of GDP through Q3 2021 (based on the Fed’s Flow of Funds report).The “bubble” is pretty obvious on this graph, and the sharp increase in mortgage debt was one of the warning signs.
The blip up in Q2 2020 was related to the collapse in GDP rather than an increase in mortgage debt. With the recent house price increases, some people are worried about a new housing bubble – but mortgage debt isn’t a concern and lending standards are much better now than during the bubble.
There is much more in the article. You can subscribe at https://calculatedrisk.substack.com/