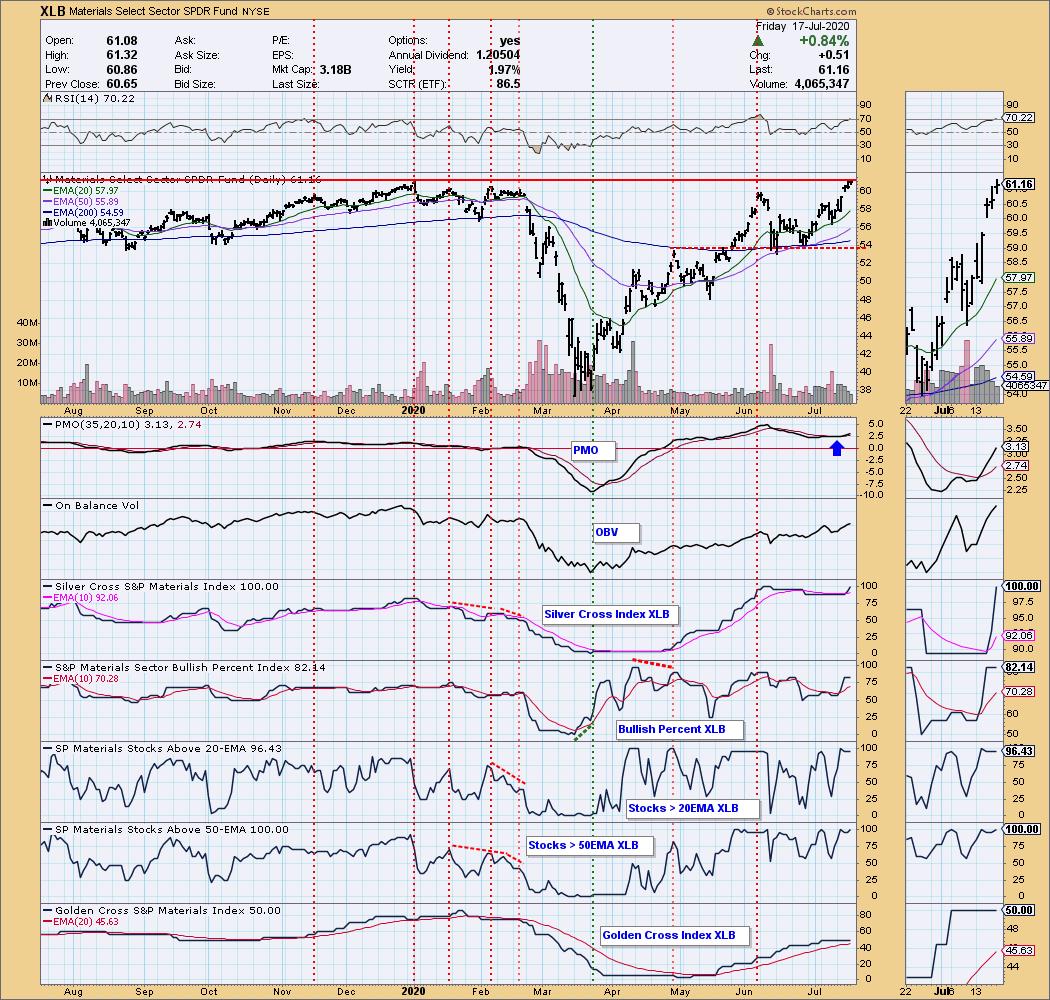
As part of my preparation of the “DecisionPoint Diamonds Report” I seek areas that are showing leadership and the Materials sector has been doing just that. The Materials sector was up 5.47% on the week which was only second to Industrials at 5.87%. The “darling” of sectors, Technology, was the big loser this week, down -1.16%. Below is the Materials sector chart (XLB) from our DecisionPoint.com Sector ChartList. We have similar indicators and annotations for the other ten available to our subscribers.
You’ll note the strength of the components in this sector as all of them are on “Silver Cross” Trend Model BUY signals (20-EMA > 50-EMA) and all them have price above their 50-EMA. Granted the RSI is getting overbought and price is bumping against strong overhead resistance, but the PMO just generated a BUY signal. I’m looking for a breakout.
Below are two of the “diamonds in the rough” that I recently highlighted in my exclusive “DecisionPoint Diamonds Report”. You get this same type of analysis of 15 stocks a week for only $25/mo…that’s 60 stocks each month! (FYI, the price of these reports will be going up substantially based on the amount of information and analysis that it takes to put these reports together. Lock in the $25/mo price now.)
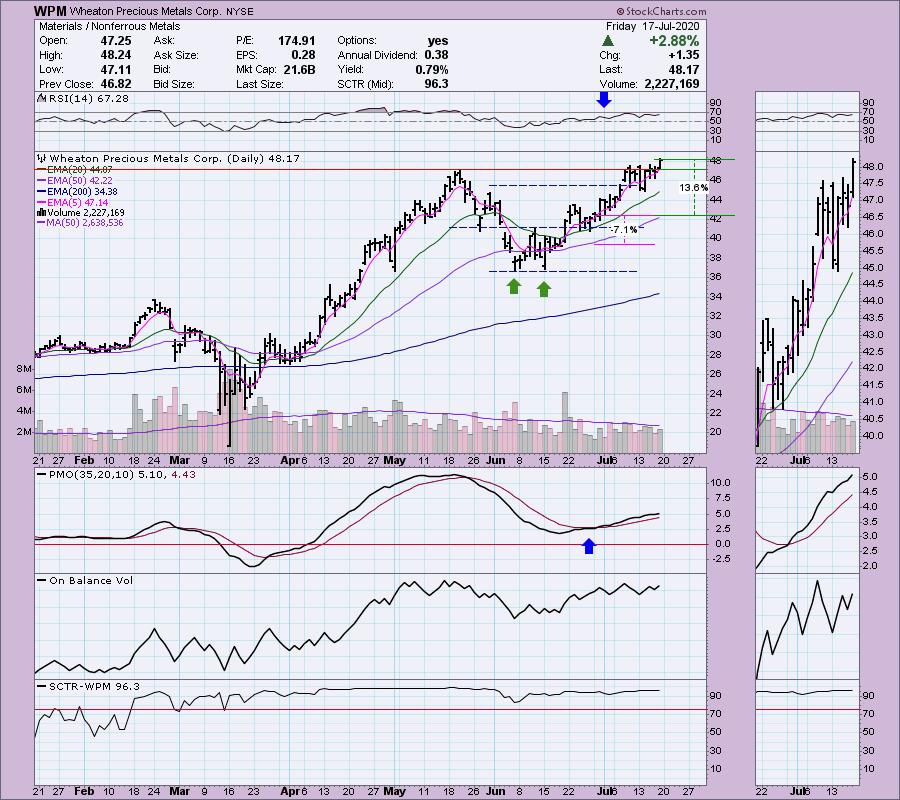
Wheaton Precious Metals Corp (WPM) – Earnings: 8/12/2020
I presented Wheaton Precious Metals (WPM) on June 29th. Below is the analysis I presented of the chart below at that time. Since then it is continuing to perform. Notice that we got the breakout above the May top as the “cup and handle” pattern suggested. I still like this one. The pink percentage is what I suggested as a possible stop area. The green is the gain so far, close to close.
June 29, 2020 Analysis:
“This is metal-related and I thought the chart looks great. At first I looked at this as a double-bottom, but I decided it made more sense as a “cup and handle” bullish formation. These patterns usually resolve to the upside and past the previous highs (like the May top). It is trying right now to breakout of the short-term declining trend that formed the “handle”. The RSI is very positive and the PMO has nearly generated a crossover BUY signal. The OBV is confirming the move with rising bottoms.”