Bitcoin ($BTCUSD) is setting up some historical patterns, and it’s worth watching to see how they play out. It’s always easier when I don’t have a crypto trade on. One of the patterns is the head-and-shoulders top. There are other patterns we could use as well, but this is a good one for something so emotional.
First of all, here is a description of a head/shoulders top. It covers off the main points really well of what typically happens during the construction of the top. So that is one piece of history that we can compare to. It’s a pattern we see in the markets a lot. What it really offers is a way to examine the current chart moves for potential failures.
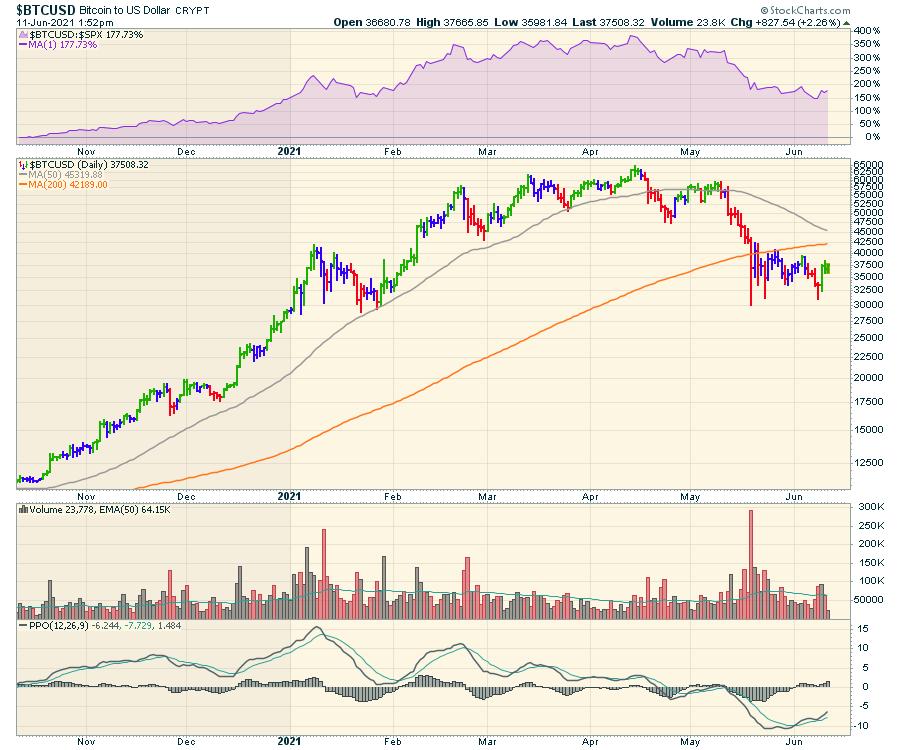
Below is a Bitcoin chart. Sometimes it is moving $2000/hour. You are allowed to buy partials, but the volatility is the same on a partial or a whole piece.
1) Notice the relative strength — RS — to the $SPX (purple area chart). Where did it top out and when did it start making lower highs and lower lows? Is it currently making lower highs and lower lows in relative strength? When did the uptrend line break?
2) We have a head/shoulders structures on the chart. A lower low, then a lower high to make the right shoulder.
3) The PPO momentum was getting weaker as the RS was flattening. Each rally had a lower peak. Eventually, it stopped bouncing and went below zero.
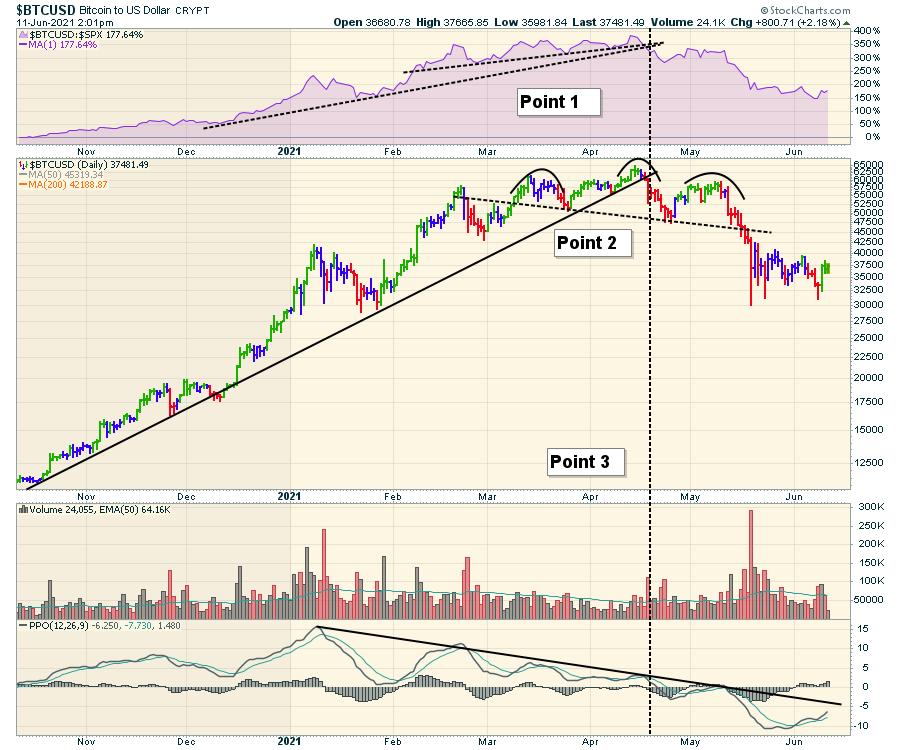
Let me add those points on the chart.
1) The relative strength — RS — to the $SPX (purple area chart). It topped out when the two different uptrend slopes broke. That was a nice sell signal. Right after that, RS started making lower highs and lower lows. The RS is still making lower lows and highs. When something is outperforming the $SPX by so much and then stops, that’s a pretty good clue that the trend in outperformance is changing.
2) We have a head/shoulders structure on the price chart. A lower high to make the right shoulder. It may or may not make a lower low first.
3) The PPO momentum was getting weaker as the RS was flattening. Each rally had a lower peak. Eventually, it stopped bouncing and went below zero. If a trader didn’t leave at the top, then the PPO rolling over at zero, after going below zero, would have been a good second exit. The PPO was also at the PPO momentum down trend line (roughly May 10) where a trader could watch for a break above or sell when the rollover occurred.
4) This topping coincided with expectations of Bitcoin to $500,000. A friend of mine in his 70s suggested buying some together through the Canadian ETF. The last chart in this article is the weekly PPO. I mentioned to him that we sell when the PPO is this high, not buy! When 70-year-olds are getting dragged in (and they are typically cautious investors), that is not a good sign. The speculative fever has reached the last remaining buyer.
The next question is “now what?” I wrote this article on Friday morning, so you will be able to click on the chart and see the most recent data.
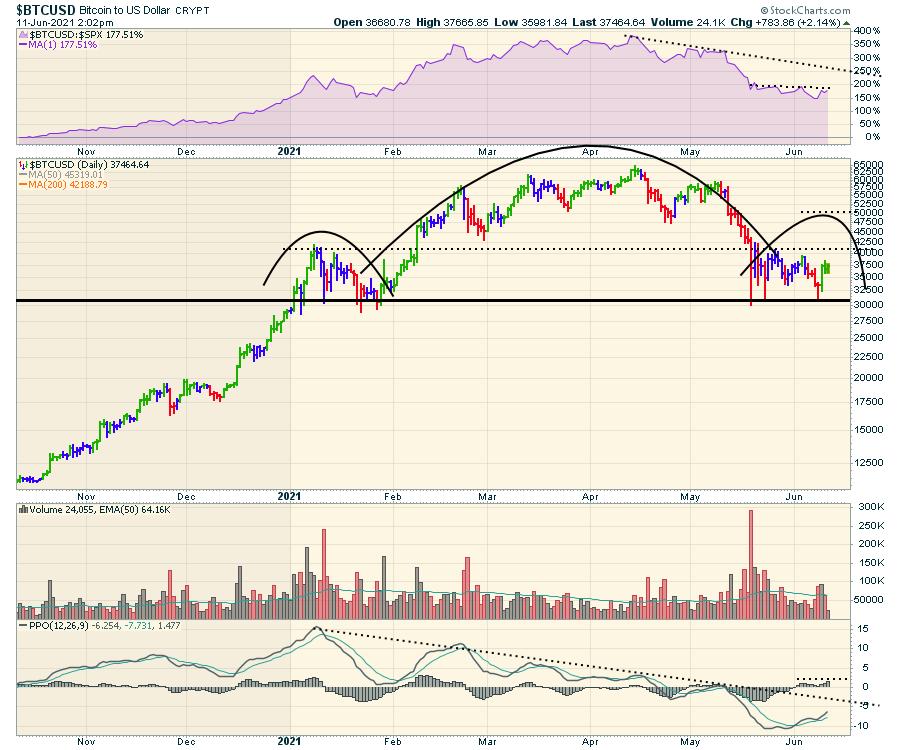
There are two RS trend lines in play, one near 200% and one near 250%. If Bitcoin is going to be in a rally I want to own, I want it to move faster than the $SPX. A breakout above the RS lower trend line is a good long signal and the RS upper trend line would be where I would expect the rally to end if it is going to roll over again. Emotions will be running fast on this chart.
For price: a couple of numbers are in play if it does rally. A breach of 40000 would put a target of 50000. There is also horizontal resistance at $47,500, which could cause some selling. The breakout above the consolidation on this right shoulder would be met with great enthusiasm.
For the PPO (a momentum indicator), if momentum is going to improve, it has to break the long downtrend. That would be the first goal, and momentum usually leads price. The second part gets hard. Not unlike back in May where the PPO stalled around zero, this is typical of something continuing a downtrend. Momentum doesn’t really get going and rolls over around zero.
When I look at the weekly, there is a lot more information to consider. It looks like a brief rally from below the 40-week moving average back up to the 10-week moving average is a possibility. But the real message here is Bitcoin usually needs more time to consolidate. Both previous examples had the weekly PPO momentum indicator well below zero, but there were some bounces along the zero line that both ended up failing.
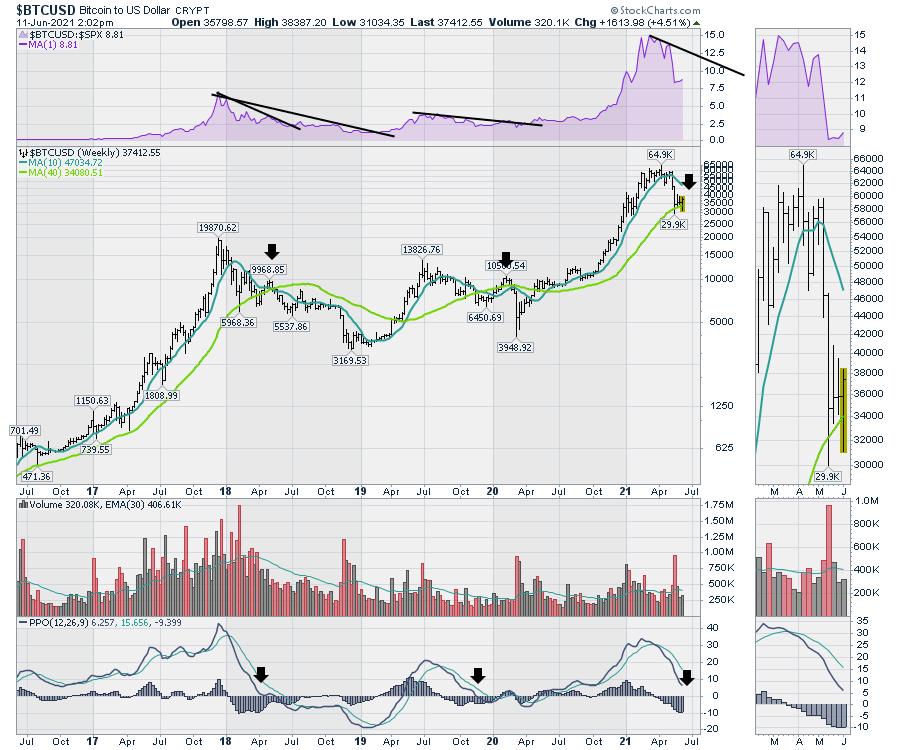
There may be a short spurious rally up to the 10-WMA (currently at $47,500 and dropping), but it may be just that, a countertrend rally. That’s my thinking. If I was trading it, my expectations would be this next rally will be swift both ways. The first downtrend after a significant RS peak was a year, and the next downtrend lasted 9 months. At 8 weeks, it looks very quick to expect the next big major up leg. It could happen, but investors might also need time for emotions to be repaired after a 50% drop.