Chapter 3 of Trading Time, titled “Concepts of Time”, is, for me, the most important chapter of the book. It was the quantum leap in my thinking up to that point and was one of the first examples of the creations of Multiple Timeframe Visualizations in one chart. Up to that point, I and anyone who I’d ever built anything for concentrated on a single timeframe for the process of building a trading system. Once done, it could then be tested and applied to other timeframes and then spliced together, creating a smoother monetary output and more stable statistics of risk.
Whilst that was all well and good, it meant that many systems, especially intraday ones, were highly active and intensive, and with that came the associated problems of cost of execution, along with order integrity and execution, in real time. I had already worked out how long a trade could last in any timeframe or market before a correction was probable and built appropriate exit code and method, but this continually presented the problem of what to do and what to build if the trend then restarted after that correction.
The solution was the birth of what I call Step Theory. Originally, using the basis of the Standard Slow Stochastic, it measured the relationship between price and when the Stochastic crossed and applied a positive integer to Steps Up Value or Down Value, depending on what that crossover relationship was. Once Steps had reached a certain threshold, that was the trending timeframe. Armed with the knowledge that no trend can last forever in the same timeframe, it was inevitable that, at some point, the trend would end and the Step Value would reset to zero. The leap forward in thinking was then to apply the same Step concept to the next timeframe higher; if it had reached that same threshold, then the trend had moved up to that timeframe and, therefore, the trade continued. This process was continuous. The end of “Concepts of Time” highlighted a case study on the Australian stock market where the trade began on 50-minute chart in 2004 at 3,600 (obviously with the trading risk that is appropriate to a 50 minute system), with the trade still being live and with a trending timeframe of weekly in January 2006 at 5,100 when the book went to print. In the end, the trade lasted until July 2007, with the Index at over 6,000.
It is almost impossible to overemphasize the staggering difference this makes. Effectively, it opens up the ability to define risk on an intraday chart, peer into The Matrix and “take the red pill, stay in Wonderland and and see how deep the rabbit hole goes.” The added bonus is the fact that individual stocks, indexes and sectors are the asset classes that trend for longest, and so the hole is the deepest.
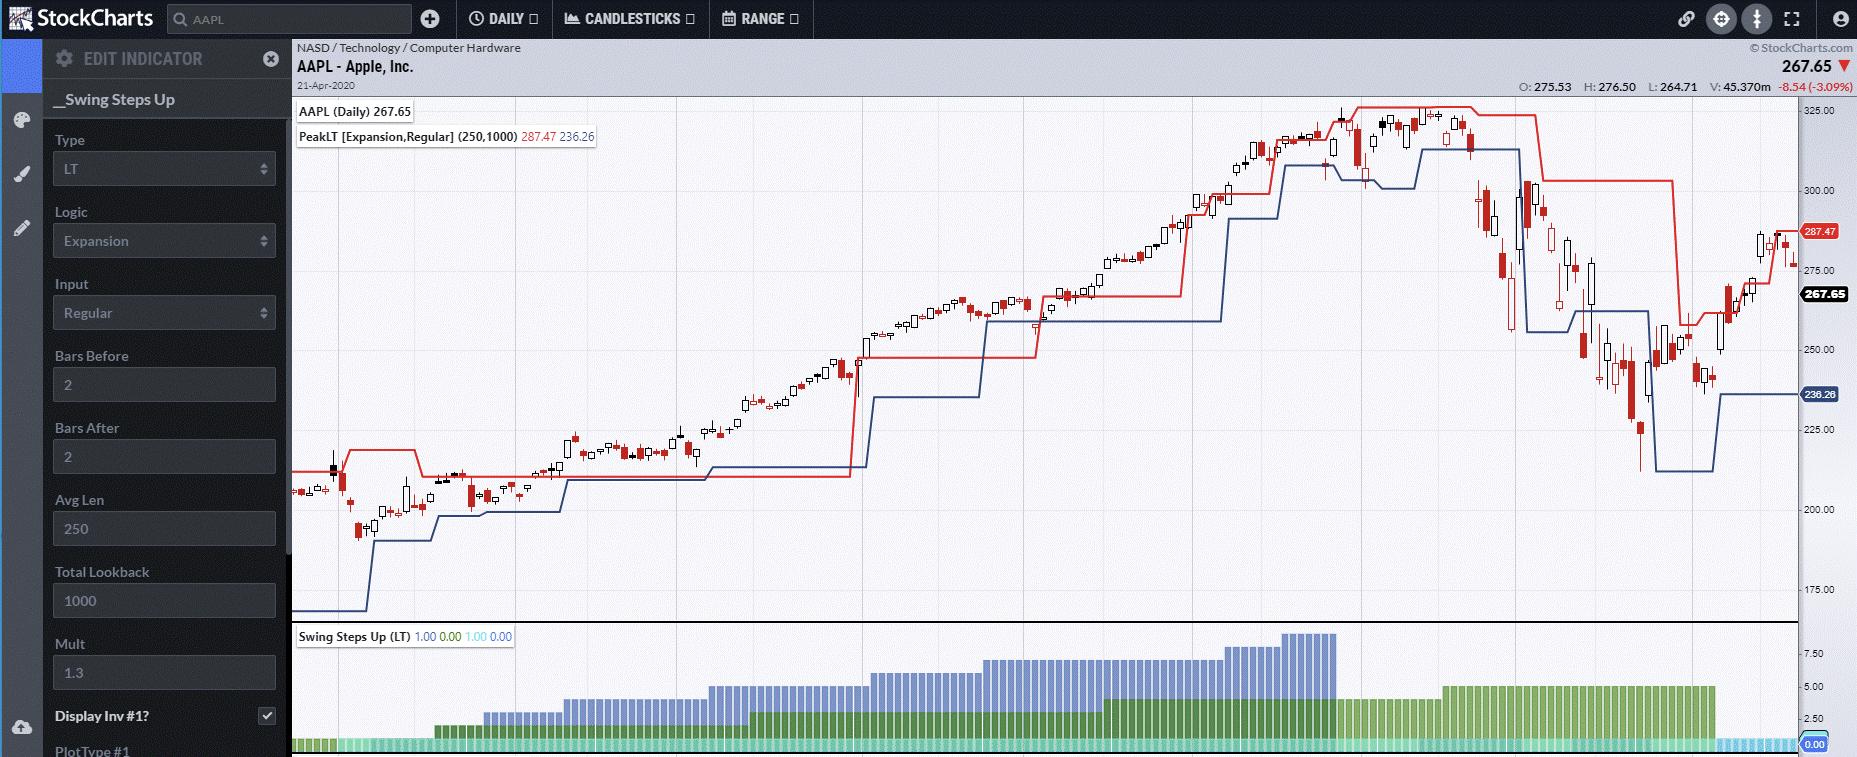
Taking the concept of moving from intraday to wherever it goes is not practical or necessary for everyone. However, whatever your strategy for entering a position in a Stock, once it develops, other Step Theories created later can be utilized. The first and most simple is Swing Steps. This has been built in to StockCharts to measure normal Swing patterns or Heiken-Ashi based, plus Peak Expansion and Peak Energy levels.
The first chart shows Apple (AAPL) on a daily chart. Below, it is Swing Steps Up based on Peak Expansion. The dark blue histogram represents the daily Step, which reached a value of 8 before resetting to zero and signaled the end of the daily trend a few days before the top.
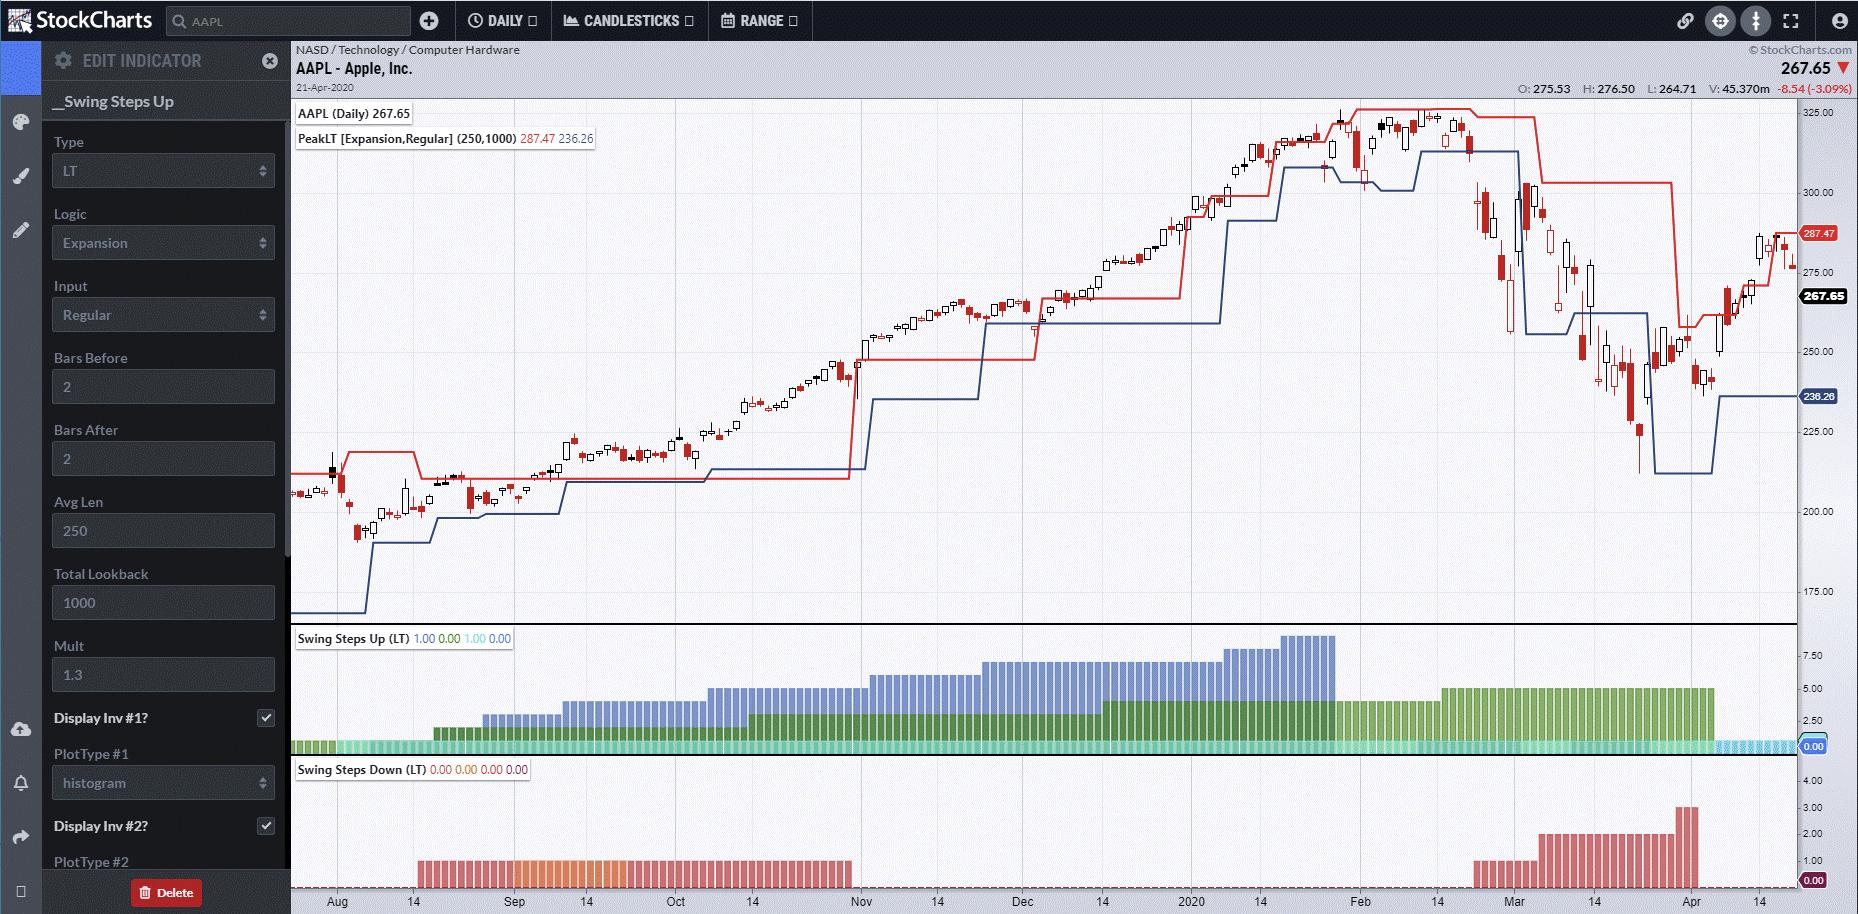
There are a multitude of different relationships between both time and Steps in either direction. The second chart is again Apple, but with Swing Steps Down added. Note how, throughout most of the rally, only the Daily Step down (red histogram) ever recorded a value, and then only of 1, but, subsequent to the Daily trend ending, it started to Step down once more.
As stocks can trend for so long, it is possible for the monthly trend to become the trending timeframe. Microsoft (MSFT) currently has a monthly value of 8.
The monthly began way back in 2010 and shifted to the trending timeframe in 2015, with the price at $37.
In the next blog, we will be looking at Stochastic Steps in more detail before moving onto Time Steps, which has particular relevance to Sector Rotation, and its relationship from weekly concepts of time all the way up to yearly, in order to identify when the Loved Sectors will fall out of favor and the Unloved will receive their time in the limelight.
I can be contacted at shaun.downey@aol.com to answer any questions.
Shaun Downey