Stack is a derivative of Time Area, its primary purpose the gauging of strength of Trend across multiple timeframes. This has particular application when comparing individual stocks within the same sector, or between different sectors in order to understand where they stand in the market hierarchy. In contrast to Time Area, Stack computes multiple relationships between current price and its previous value. Designed to be used on Daily data as its base, it calculates on Daily, Weekly, Monthly, Quarterly, Semi-Annual and Yearly data.
When assigning a value to that relationship, it will produce either a positive or negative integer depending on the outcome, meaning that the maximum or minimum value is Plus or Minus 15.
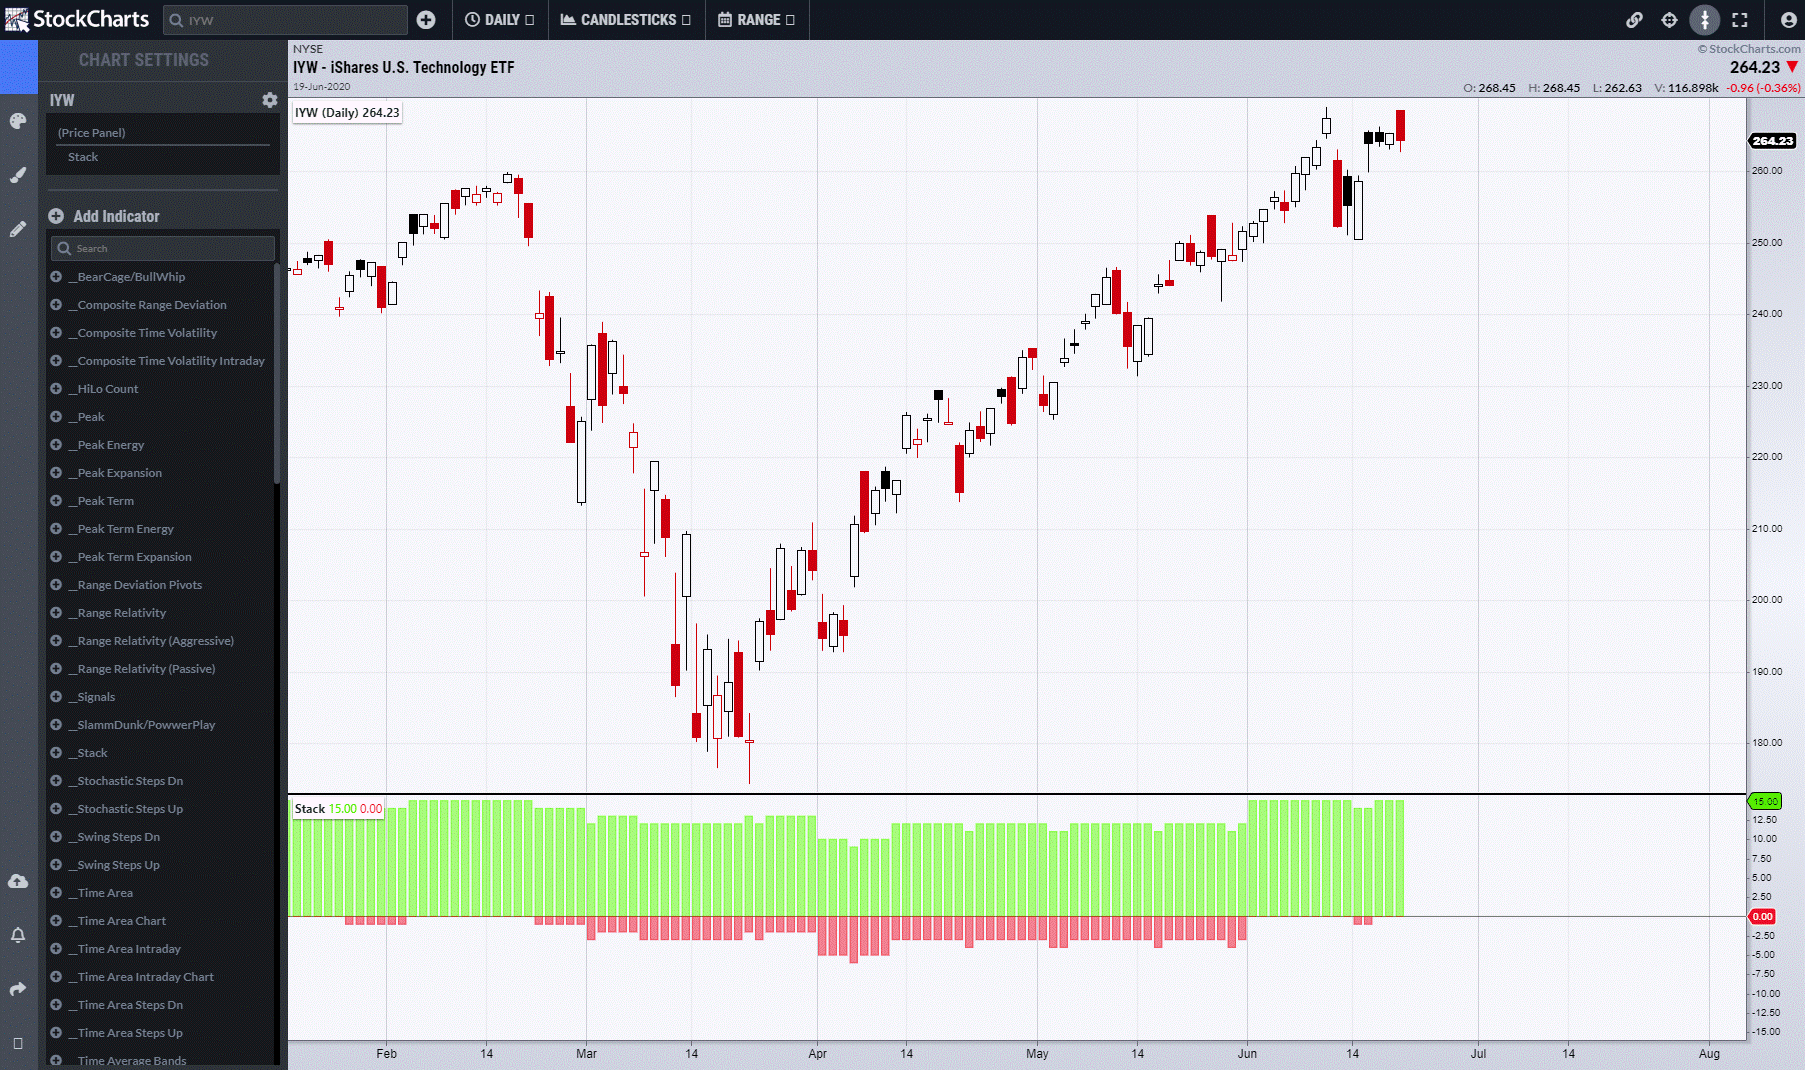
Beginning with sectors, it is not surprising that Tech is top of the tree at 15. The next strongest are in the Medical and Biotech world, but one really stands out, which is Home Builders. It has a Stack value of 11, but, when looking at the sector’s fundamental performance and stats, it is languishing in the lower mid-table. This suggests that the price performance is out of sync and, in the current environment, it is easy to see why.
IYW:
XHB:
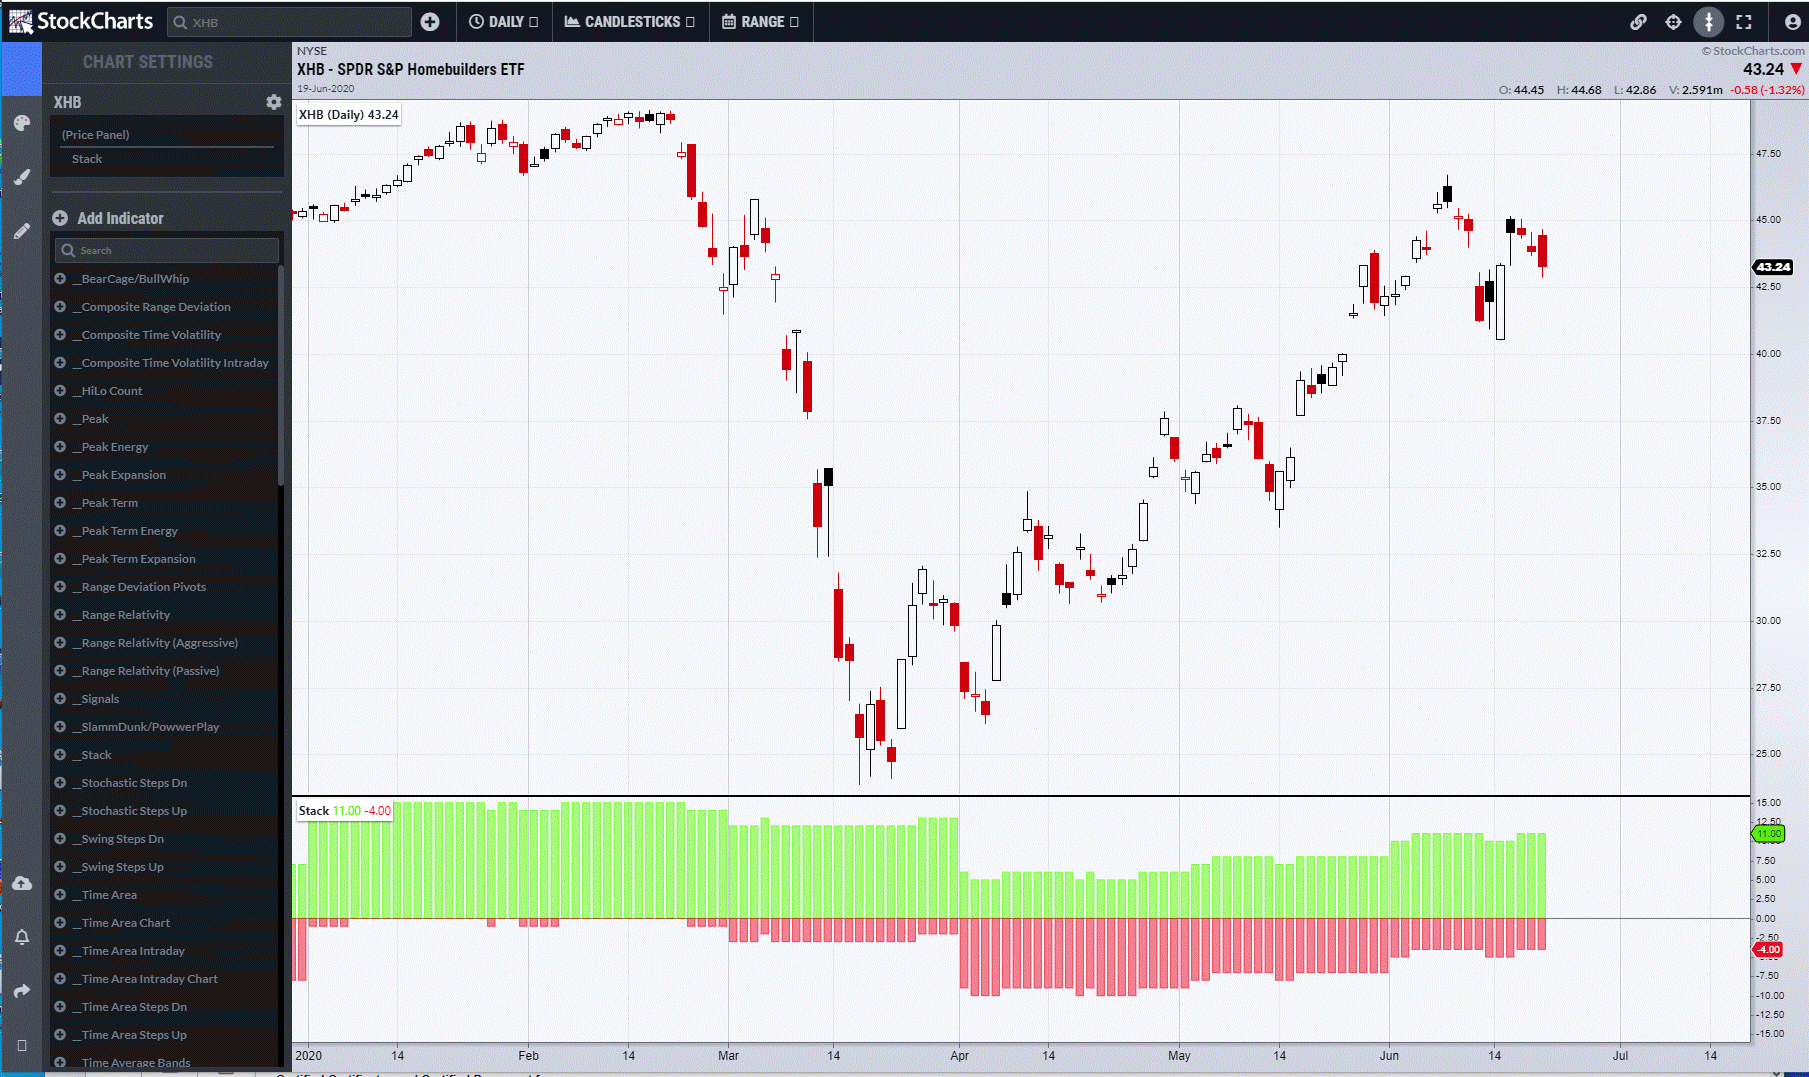
Further analysis of XHB reveals that their title is a little disingenuous based on their main holdings. Only 28% of the ETF holdings are actually in Homebuilding; this highlights the need to do proper digging. The ETF ITB is more like it, as it has 65% directly in Homebuilding and also has a Stack value of 11.
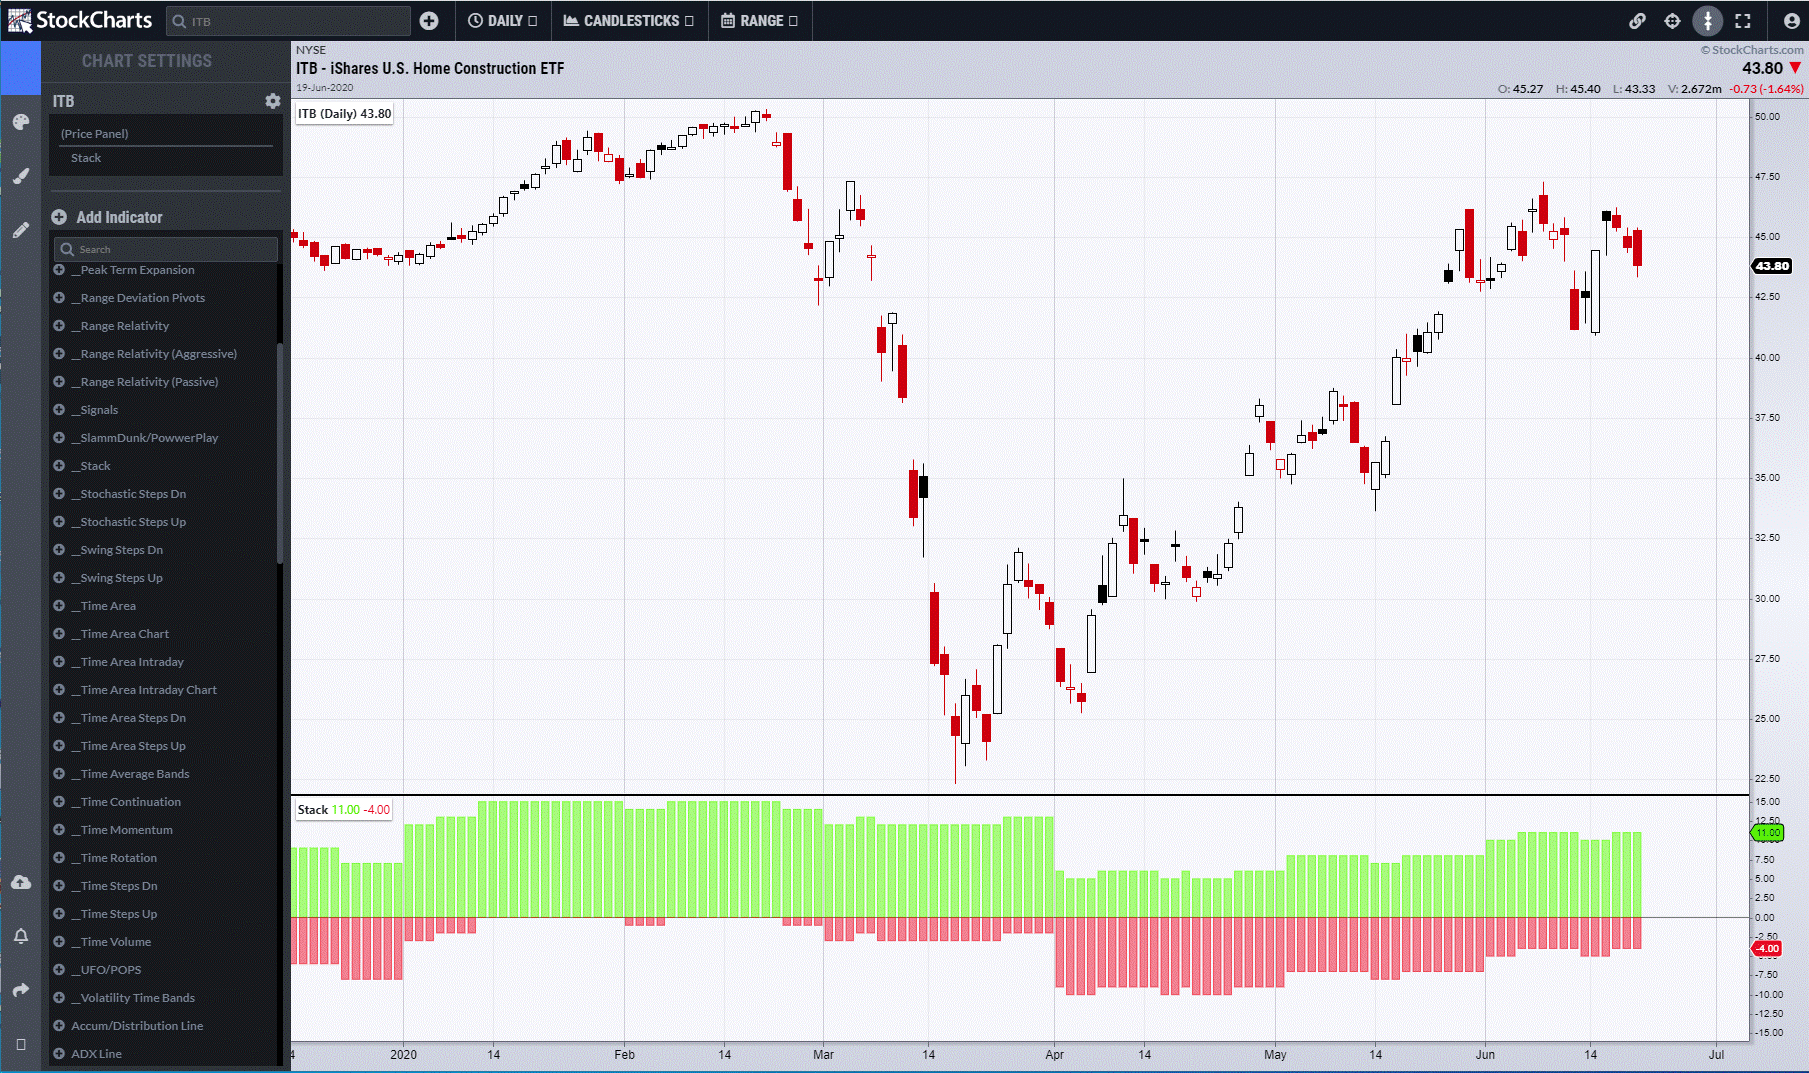
Therefore, the next process is to look at the top holdings and compare their technical picture with Stack and Time Area.
The biggest holding is in Horton (DHI) and the chart shows that it also has a value of 11 and is nearly back at its highs. Time Area shows that it is still stepping up, which means that the topping process for a loved stock still has some time to play out.
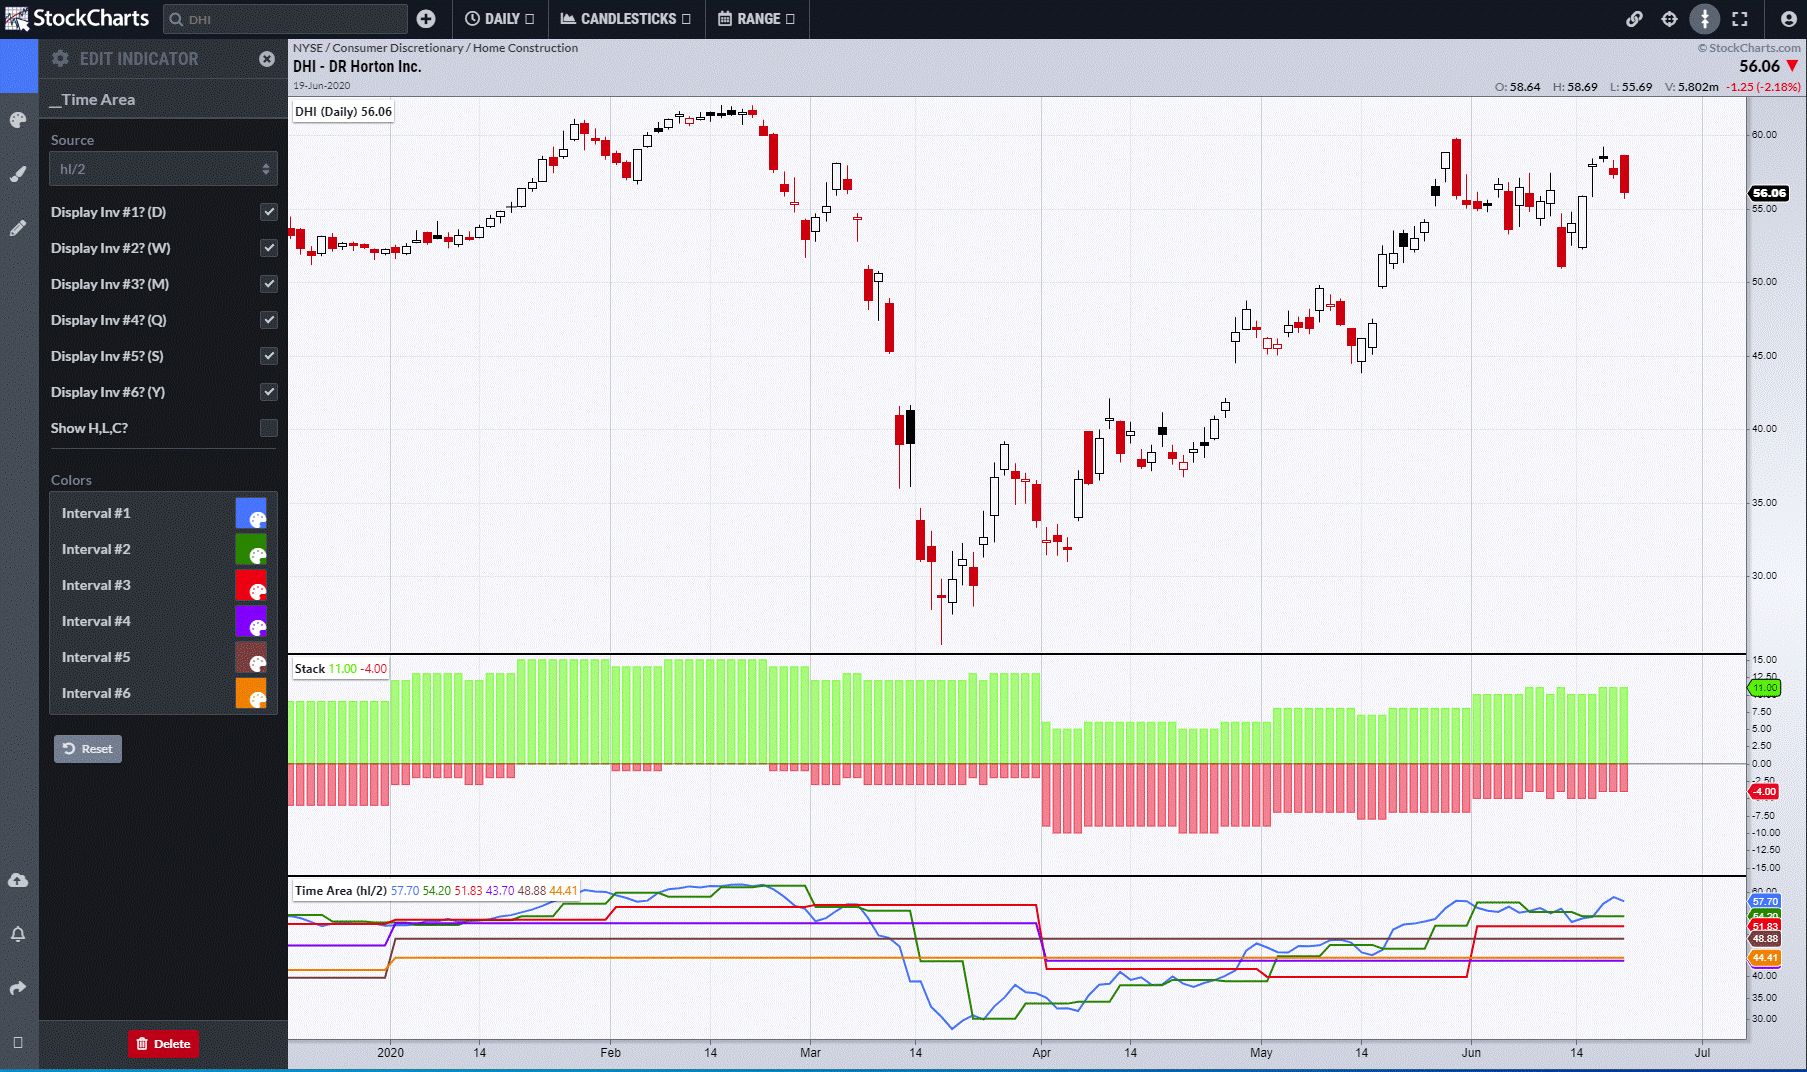
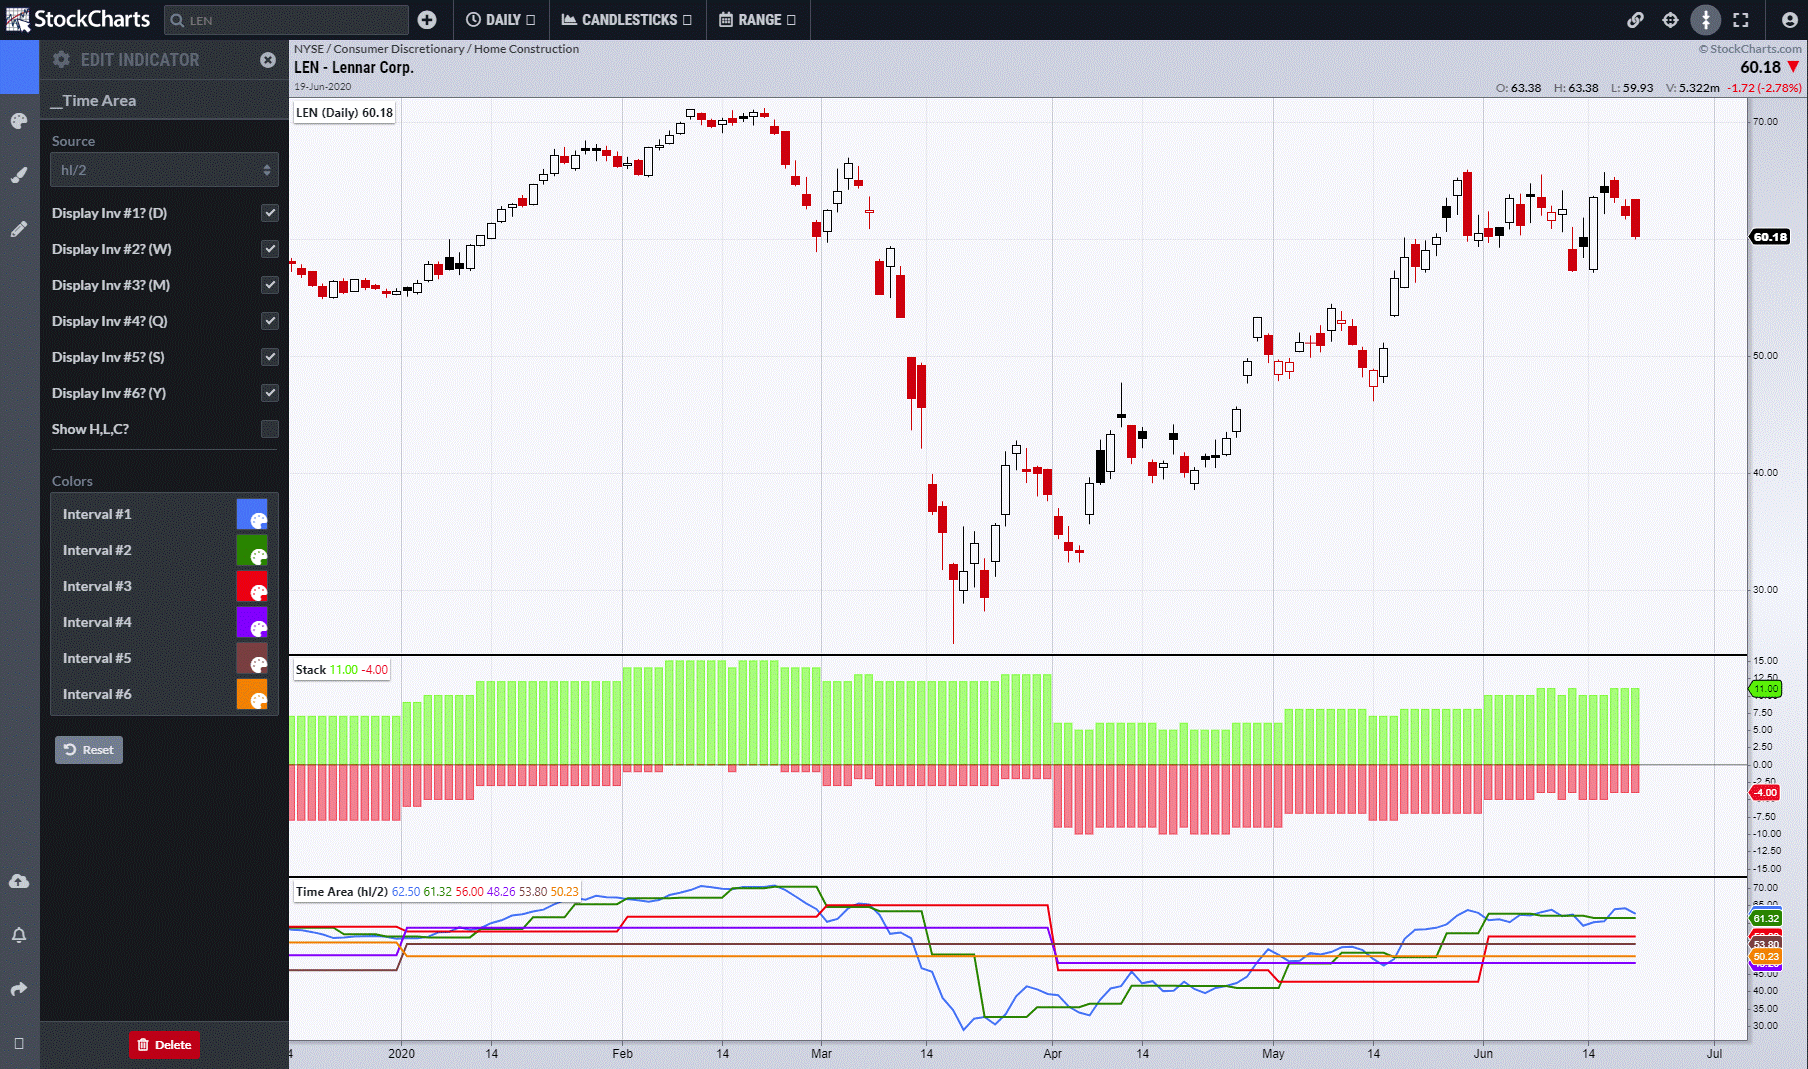
Lennar (LEN) is in a similar position, with support still all below.
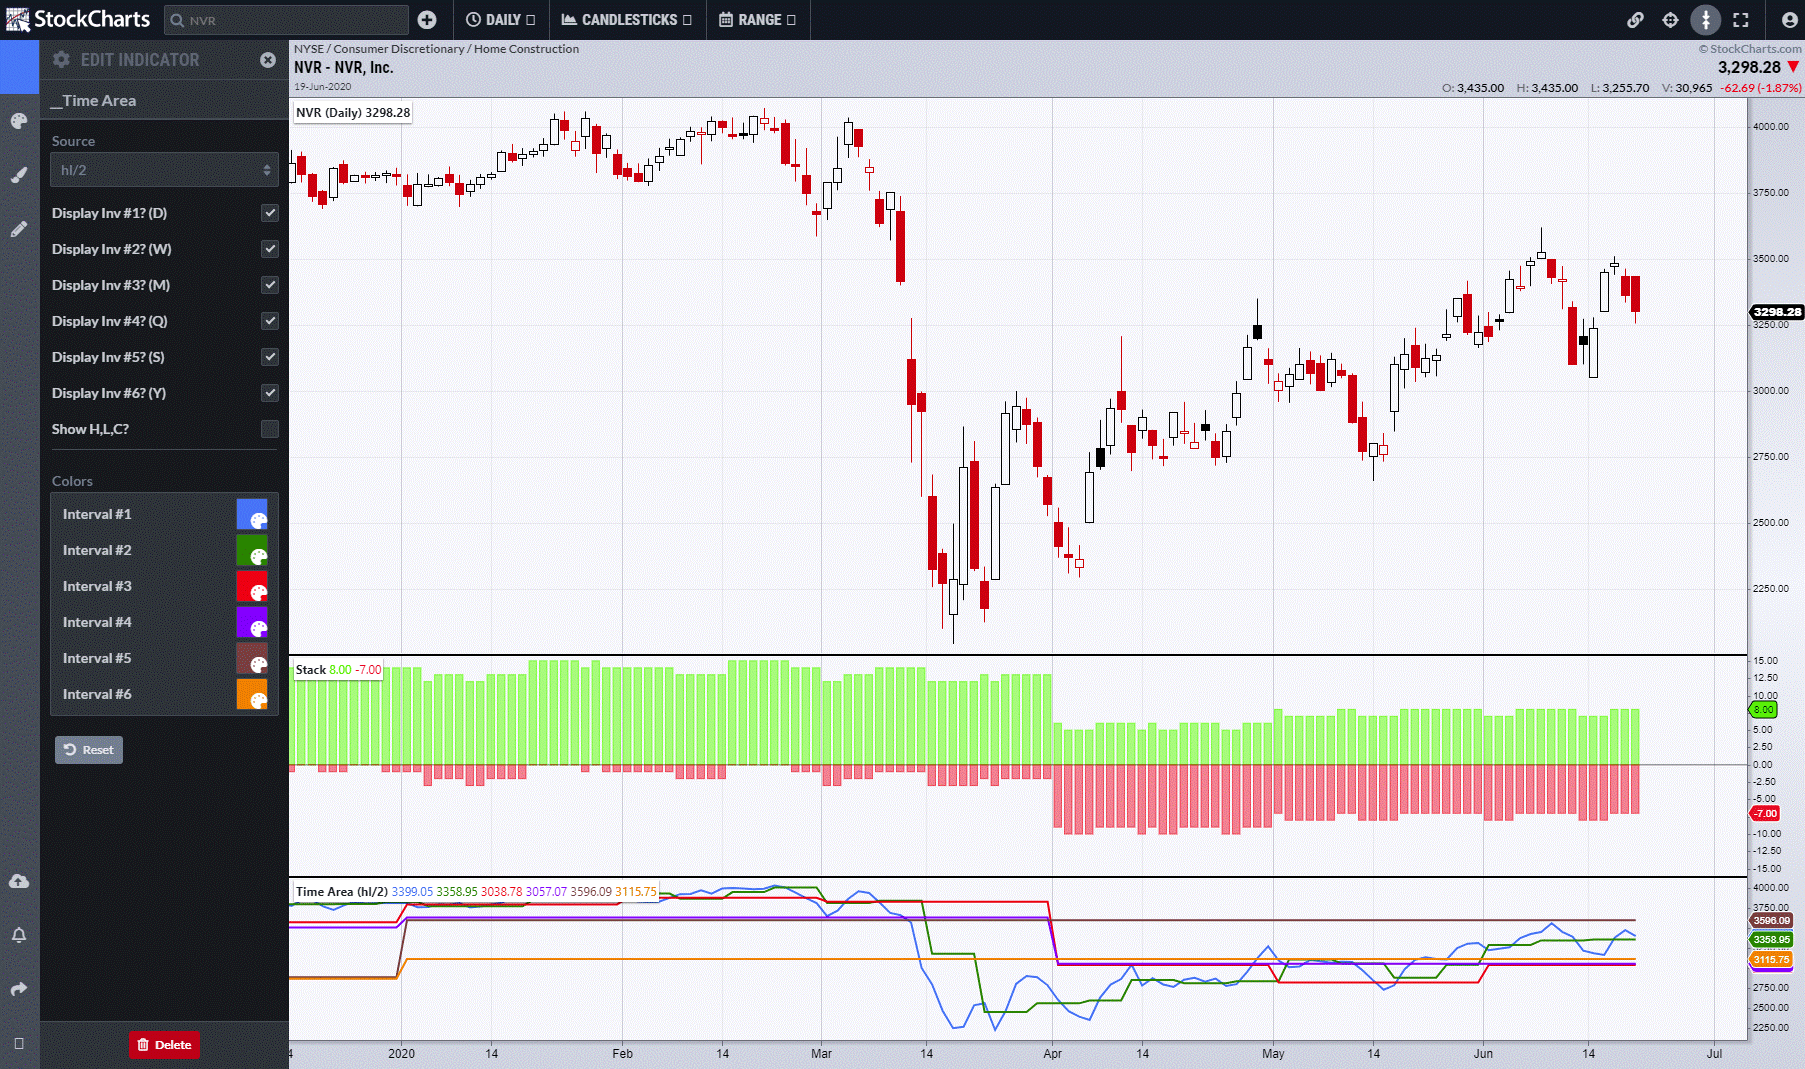
NVR is slightly different, as it still has a semi-annual level as resistance.
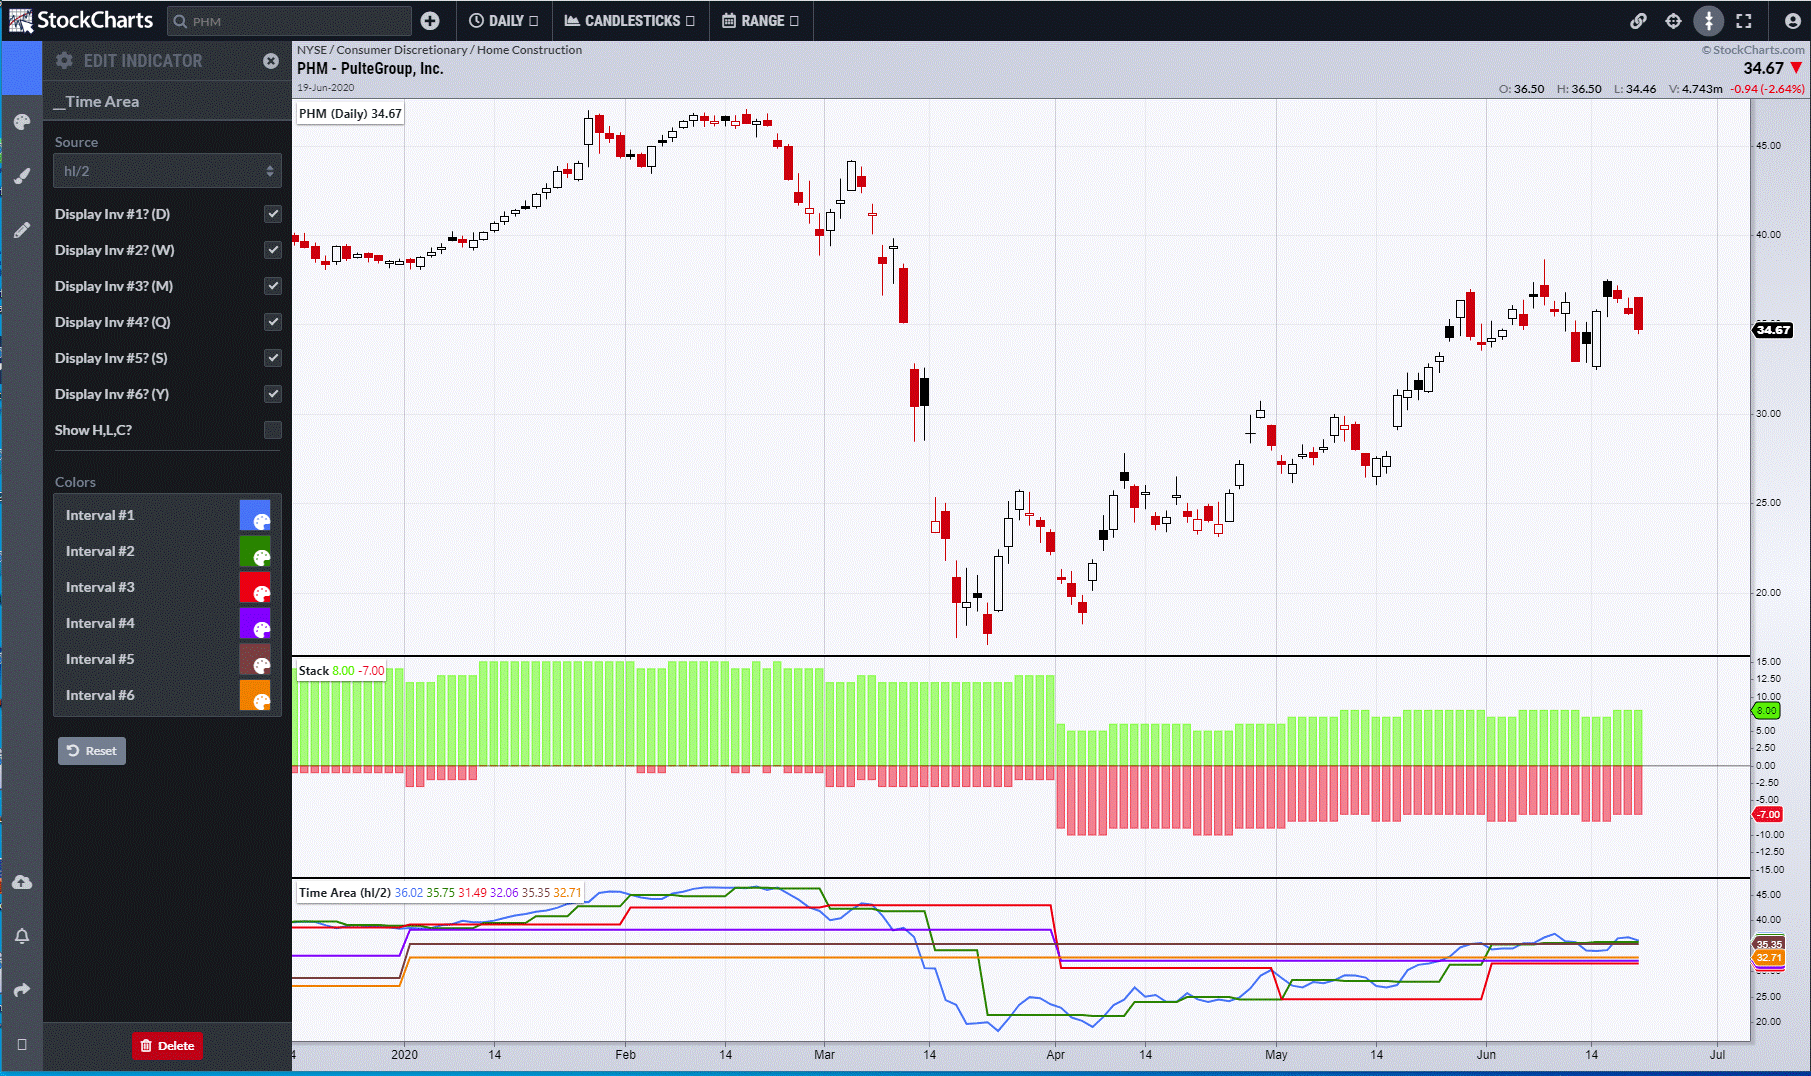
PHM remains in a positive framework, but has created a confluence of nearby support from 32.71 to 31.49. The monthly, quarterly and semi-annual values will change at month-end and will require monitoring to see how the dynamics change.
Finally, Toll Brothers (TOL) is by far the weakest, as levels remain above and support is adjacent.
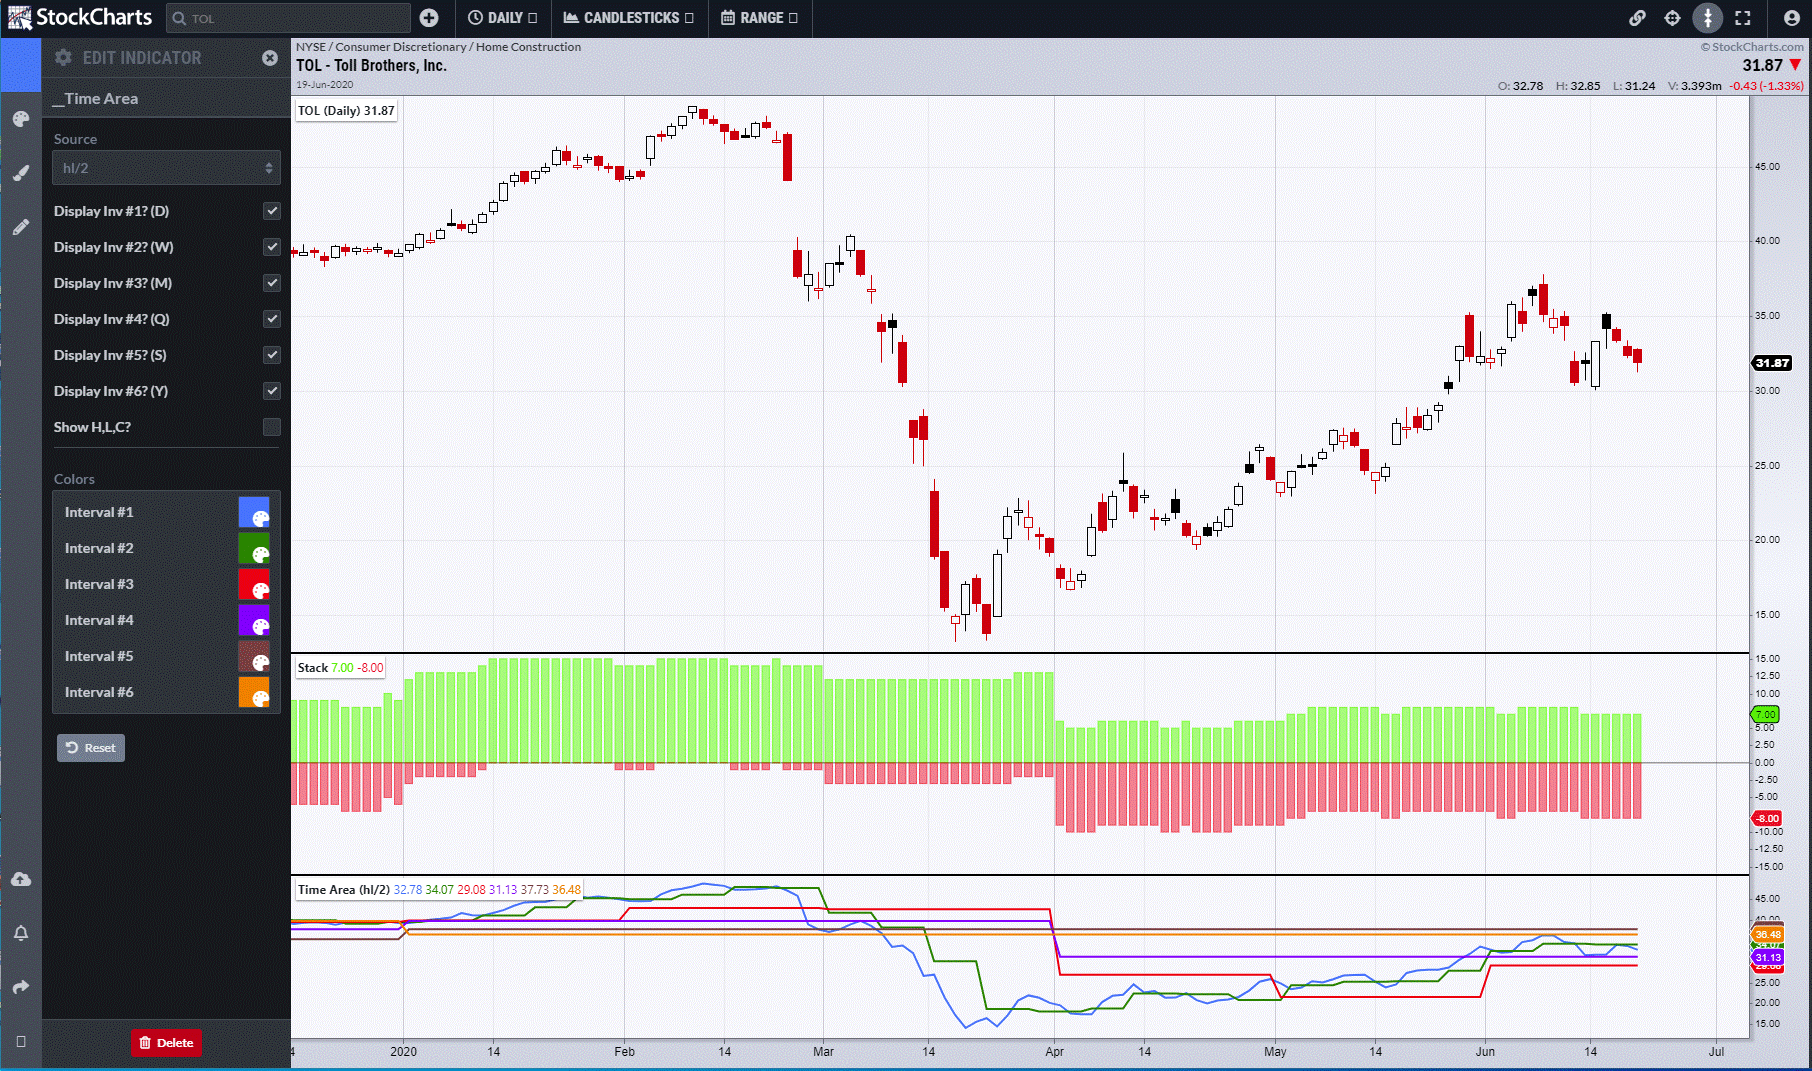
So, in conclusion, we now know the internal framework of Home Builders, with Horton the strongest and Toll the weakest, the latter being the favoured play if looking for a negative.
I can be contacted at shaun.downey@aol.com to answer any questions.
Shaun Downey