In a January 20 article Jeremy Grantham proposed that there are currently bubbles in housing, equities, and bonds, and a half-bubble in commodities. In this article I will only address the current housing bubble. An immediate response might be, “What bubble?” We continue to hear how inventories are so lean, and how bidding for for homes is so fierce that buyers being forced to offer far above the listing price to be competitive. Don’t look now, but buying frenzies are kind of typical for market tops. The problem, of course, is that rising interest rates will squeeze buyers out of the market.
The question asked by most buyers is usually, “How much per month?” There is usually a maximum amount that a buyer can afford, and that is controlled by the price of the home and the interest rate (30-year fixed). Either one of these factors alone can shut down a buyer.
This week the 30-year fixed rate hit a two-year high of 3.69%.
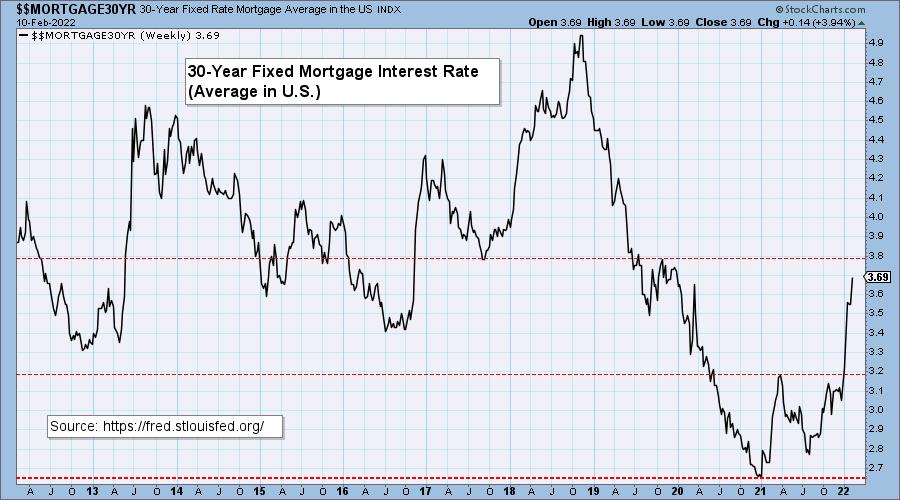
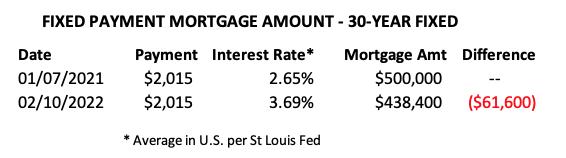
For about a year we have been tracking the effect that rising interest rates are having on potential buyers. On the chart below we started with the rate of 2.65% on January 7, 2021, which was the lowest point of the last 50 years (by a long way!). Assuming a loan amount of $500,000, we get an arbitrary maximum payment of $2,015. In order to keep that payment amount with the current rate of 3.69%, the maximum amount the buyer can borrow is $438,400, which is 12.3% less than at our starting point of $500,000.
As we said before, another factor putting houses even farther out of reach of buyers is rising home prices. According to the Case-Shiller page on the Real Estate Decoded web site, home prices in the U.S. have increased 16.9% from January 2021 through November 2021.
CONCLUSION: Once again, we are approaching a financial crisis caused by real estate. (Thank you, Federal Reserve!) Remembering that it only took single bubbles in 2000 (equities) and 2007 (housing) to cause major problems for the financial markets, what will it be like to experience the collapse of three-and-a-half bubbles?

Click here to register in advance for the recurring free DecisionPoint Trading Room! Recordings are available!
Technical Analysis is a windsock, not a crystal ball.
–Carl Swenlin
(c) Copyright 2022 DecisionPoint.com
Helpful DecisionPoint Links:
DecisionPoint Alert Chart List
DecisionPoint Golden Cross/Silver Cross Index Chart List
DecisionPoint Sector Chart List
Price Momentum Oscillator (PMO)
Swenlin Trading Oscillators (STO-B and STO-V)
DecisionPoint is not a registered investment advisor. Investment and trading decisions are solely your responsibility. DecisionPoint newsletters, blogs or website materials should NOT be interpreted as a recommendation or solicitation to buy or sell any security or to take any specific action.