The Fed has already hiked rates three times this year and is expected to hike again on Wednesday, July 27th. But with the economy showing signs of significant slowdown, there are rumors that the Fed might not hike rates as much as anticipated.
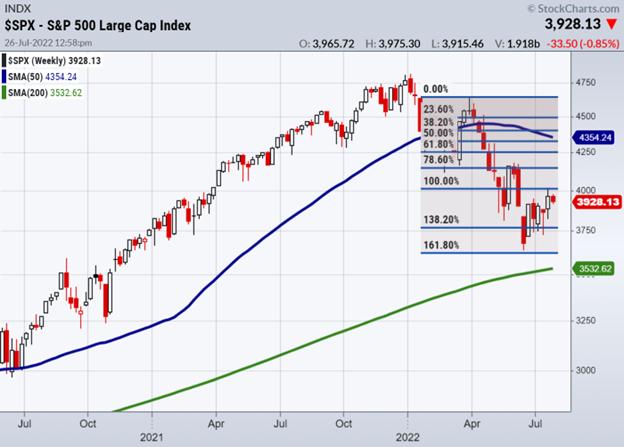
The current downtrend, which began in April, has retraced to the Fib ratio of 100%. The key level to watch on the upside is if the market pushes through resistance at 4,000. Above that, resistance remains at 4,120. The key level to watch on the downside is a break below 3,850, which indicates a retesting of past lows.
We are clearly in a stagflationary environment, as evidenced by Walmart and several other retailers reporting. With US inflation at a 40-year high and food-price inflation soaring, Americans are spending more on necessities. As for the recession, it is still too soon to tell. Economists and politicians have various views on the data and the metrics. The debate over whether or not the U.S. is in a recession and how many rate hikes are coming lies in the data that will be released in the coming months.
What do our proprietary indicators say?

Some of the answers to those questions will come from the current earnings season, when businesses report on Q2. Additionally, various following economic reports will give a snapshot of the state of the economy. Several of our indicators are pointing towards risk off.
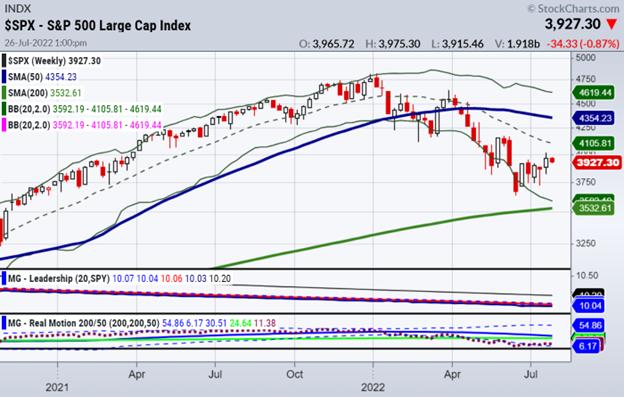
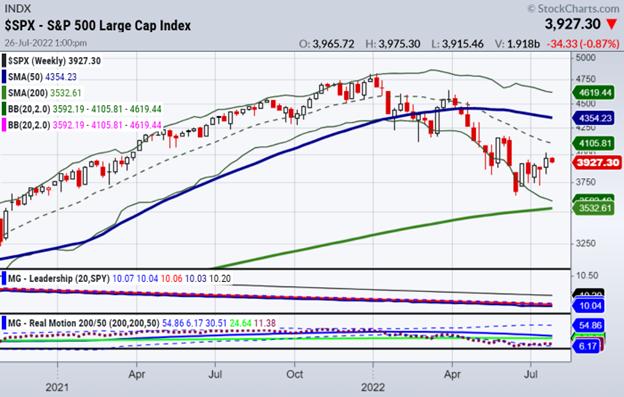
Our momentum indicators of “real motion” have a highly predictive power in being able to anticipate downturns. The momentum is leading the market down, as you can see above. Investors should be prepared for a potential pullback.
What lies ahead is the question on everyone’s mind right now, but in my view inflation and slow growth will continue to be part of our lives for much longer than the Fed is forecasting. Economic growth is continuing to decline, and the pace of decline is likely to accelerate. Putting this all together, the market is in a trading range, and the trend is still to the downside.
Another question for investors is whether, if current levels hold, it will be a false rally or the beginning of a genuine recovery. The answer will have important implications for asset allocation and portfolio construction.
Click here to learn more about real motion and other MarketGauge indicators.

 Get your copy of Plant Your Money Tree: A Guide to Growing Your Wealth and a special bonus here.
Follow Mish on Twitter @marketminute for stock picks and more. Follow Mish on Instagram (mishschneider) for daily morning videos. To see updated media clips, click here.
Mish in the Media
In this interview by Dale Pinkert during the F.A.C.E. seminar, Mish examines different sectors using the 50- and 200-week moving averages.
Mish presents “Working as a Trader” on Business First AM.
Also from Business First AM, Mish explains what to look for before putting cash back into the market.
ETF Summary
- S&P 500 (SPY): 403 big resistance, and today we saw how 390 support is pivotal
- Russell 2000 (IWM): 176.50 support to hold; now must take out 182.50
- Dow (DIA): 322-323 resistance, 316 support
- Nasdaq (QQQ): 308 big resistance, 293 support key
- KRE (Regional Banks): 60 key support
- SMH (Semiconductors): 221 support, 230 resistance
- IYT (Transportation): Second weakest modern family sector as it broke below the 50-DMA
- IBB (Biotechnology): Support 120
- XRT (Retail): Weakest modern family sector; now back below the key 200-WMA at 60.92
Mish Schneider
MarketGauge.com
Director of Trading Research and Education