It was a busy week for updates when 513 companies delivered their financial statements for the quarter ended June. With 63% of the market capital value now reported we can begin to see the shape of the decline. Sales growth was down on average and more frequently as we might have expected. All sectors recorded a decline except the technology sector where sales growth near 14% is low in the record of the sector and higher than last period.
Q2 2020 hedge fund letters, conferences and more
Overall the sales growth rate is holding up well near 7% and although frequency of improvement has fallen to 39% from 53% last period, frequency of improvement is still high relative to recession trough levels of 8% during the Financial Crisis and 24% during the Tech Bubble. An improvement in the frequency of rising sales growth will be our first hint that this steep decline in growth is over.
Gross Margin as the Key Indicator
It is the gross profit margin that wags this dog. We have reliable history that, for as long as the average gross profit margin declines, stocks will continue their downtrend relative to bonds. That makes the recent rally in shares a good opportunity to improve the attributes of your portfolio. This is the third consecutive quarter of lower gross profit margin from the highest level on record last year.
Frequency of improvement in the gross profit margin fell to 35% from 52% last period. That is the lowest frequency of improvement in the 25-year data record. The unusually widespread gross profit margin decline may be related to a reluctance to lay people off in the context of the Cares Act and Payroll Protection Plan (PPP).
Cash being added to Balance Sheet
Companies raised a very large volume of capital in both debt and equity markets last quarter as the wide-open money spigot and unusually low interest rates encouraged corporations to borrow now. Unlike earlier periods in this now 12 years of ultra-loose monetary policy, companies are not borrowing to build. Rather cash is added to the balance sheet to defend the company against the looming insolvency (negative cash flow).
PPP has appeared very infrequently. Public companies have not broadly availed themselves of these funds and the volume of PPP is tiny relative to the cash raised in the public bond and stock markets. Financial condition has weakened further, and the recent strong share price advances are providing an important opportunity to sell shares of falling growth companies with weak financial condition.
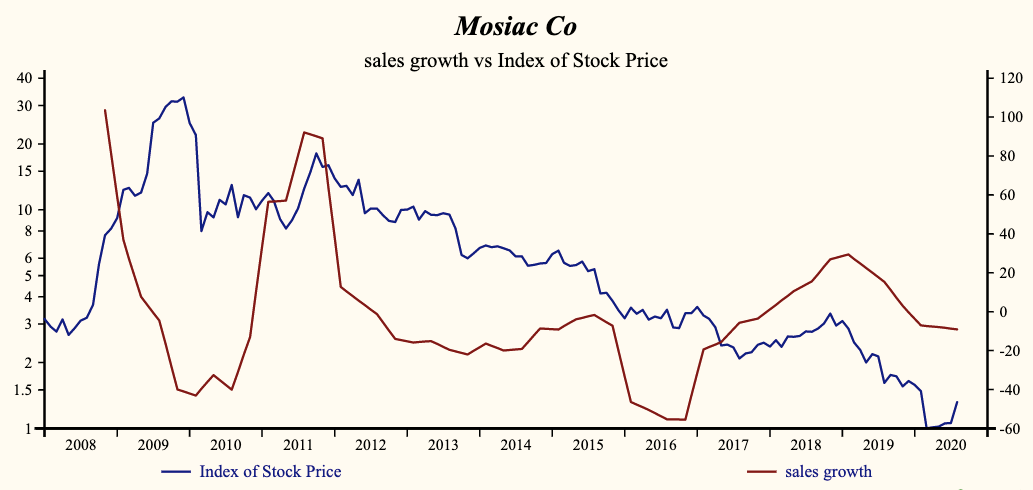
Mosaic Co: Sales Growth pointing downwards
It appears less likely now that the second quarter will mark the bottom of the growth decline. Sales growth is likely to continue down in the third quarter. Although the gross profit margin is down on average, the EBITD (operating) profit margin is up (slightly). This illustrates that companies are reducing SG&A (selling, general and administrative) expenses at a more rapid rate. This is a common early response to top line weakness and temporarily supports cash flow.
The surprise comes next quarter when the top-line remains weak and companies exhaust their cost cutting. The EBITDA profit margin and cash flow will fall steeply. With share prices now broadly extended, this is an excellent time to sell shares of falling growth companies and move to the shrinking number of improving companies with good financial condition. Such as Mosaic Co (NYSE:MOS).
Mosaic Co $17.190 BUY this rich company getting better
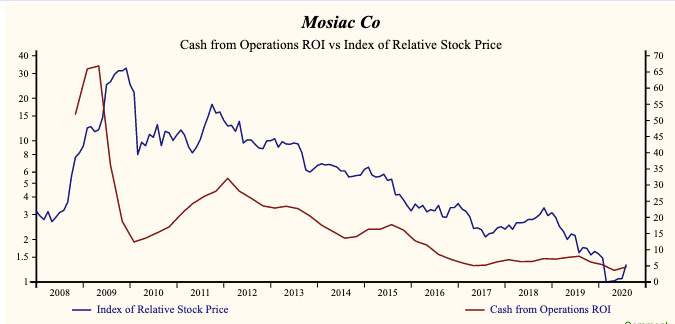
Mosaic Co has been an exceptionally profitable company with persistently high cash return on total capital of 18.1% on average over the past 13 years. Over the long term, the shares of Mosaic Co have declined by 93% relative to the broad market index.
The shares have been highly correlated with trends in Growth Factors. The dominant factor in the Growth group is Cash from Operations ROI which has been 90% correlated with the share price with a three-quarter lead.
Currently, sales growth is -9.1% which is higher than the long-term growth record but lower than last quarter. Receivable turnover has been steady over the past 2 years implying a higher quality sales growth trend.
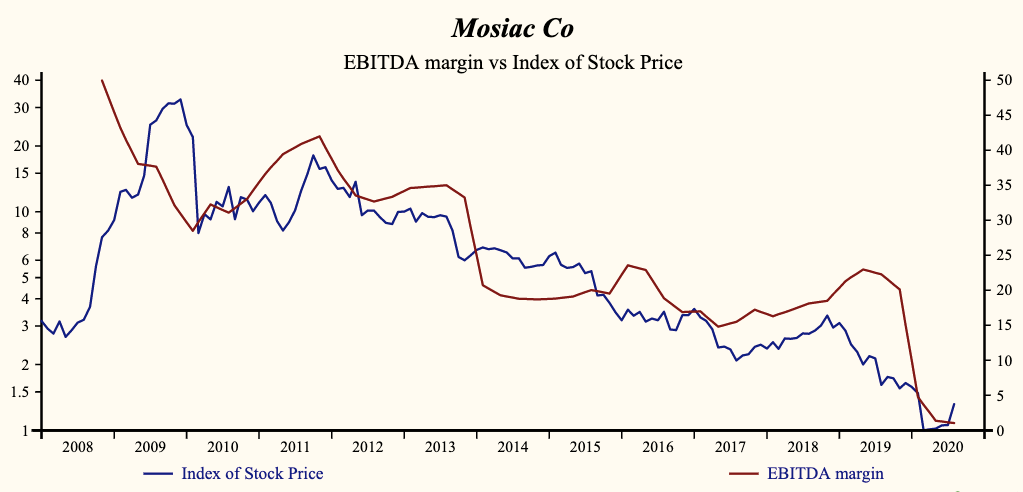
The company is recording a low and rising gross profit margin. SG&A expenses are high in the record of the company but rising. That implies that the company may be capable of accelerating EBITD relative to sales with lower costs, but has yet to achieve a cost reduction. SG&A expenses are rising at a faster rate than the gross margin, producing a falling EBITD margin.
The current indicated annual dividend produces a yield of 1.5%. Current trailing operating cash-flow coverage of the dividend is 13.2 times. More recently, the shares of Mosaic Co have declined by 61% since the October, 2018 high.
The shares are trading at upper-end of the volatility range in a 21-month falling relative share price trend. Despite the recently extended share price, the broad improvement in fundamentals forces a reversal of Otos July, 2019, sell decision.
The post Shape of the Decline appearing in Financial Statements appeared first on ValueWalk.


