Note: There will be no weekend updates.
IMPORTANT: For “herd immunity” most experts believe we need 70% to 85% of the total population fully vaccinated (or already had COVID).
 Click on graph for larger image.
The CDC is the source for all data.
The 7-day average deaths is the highest since March 1st.
According to the CDC, on Vaccinations. Total doses administered: 383,994,877, as of a week ago 378,569,717. Average doses last week: 0.78 million per day.
| COVID Metrics | ||||
|---|---|---|---|---|
| Today | Week Ago |
Goal | ||
| Percent fully Vaccinated | 54.4% | 53.6% | ≥70.0%1 | |
| Fully Vaccinated (millions) | 180.6 | 177.9 | ≥2321 | |
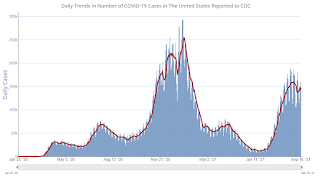
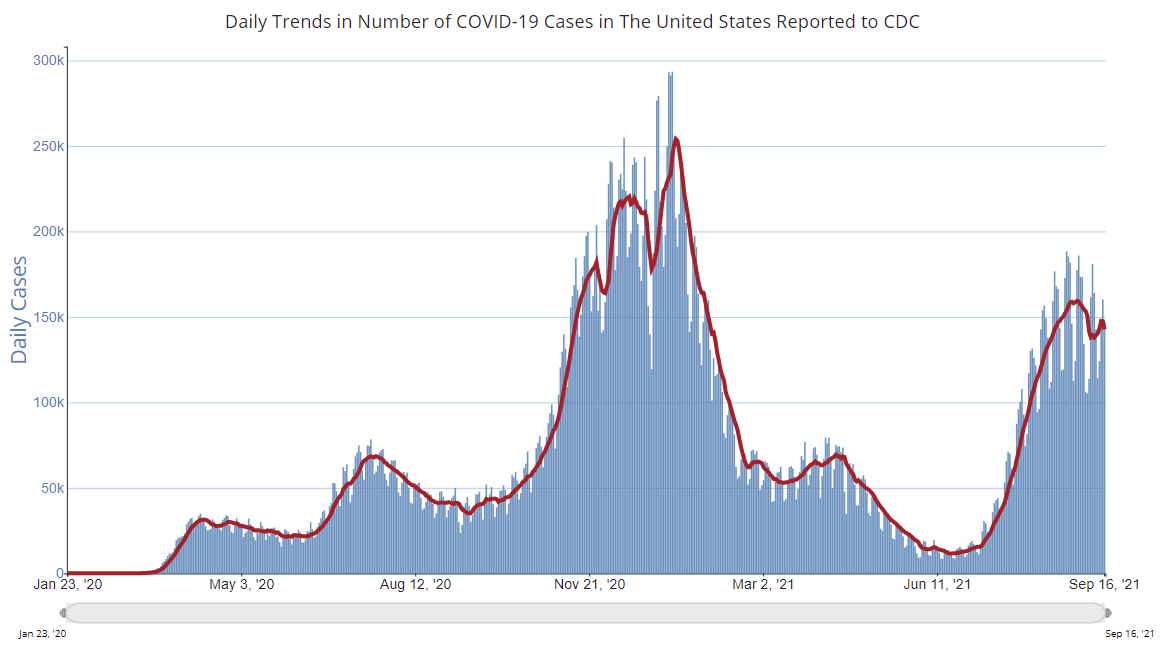
| New Cases per Day3🚩 | 142,736 | 139,221 | ≤5,0002 | |
| Hospitalized3 | 88,506 | 93,097 | ≤3,0002 | |
| Deaths per Day3🚩 | 1,464 | 1,253 | ≤502 | |
| 1 Minimum to achieve “herd immunity” (estimated between 70% and 85%). 2my goals to stop daily posts, 37 day average for Cases, Currently Hospitalized, and Deaths 🚩 Increasing 7 day average week-over-week for Cases, Hospitalized, and Deaths ✅ Goal met. |
||||
IMPORTANT: For “herd immunity” most experts believe we need 70% to 85% of the total population fully vaccinated (or already had COVID).
This is all from the CDC – state data may differ!
KUDOS to the residents of the 11 states that have achieved 60% of total population fully vaccinated: Vermont at 68.8%, Massachusetts, Maine, Connecticut, Rhode Island, Maryland, New Jersey, Washington, New York, New Mexico, New Hampshire at 60.9%.
The following 18 states and D.C. have between 50% and 59.9% fully vaccinated: Oregon at 59.6%, District of Columbia, Virginia, Colorado, Minnesota, California, Hawaii, Delaware, Pennsylvania, Wisconsin, Florida, Nebraska, Iowa, Illinois, Michigan, South Dakota, Kentucky, Arizona and Kansas at 50.0%.
Next up (total population, fully vaccinated according to CDC) are Texas at 49.8%, Nevada at 49.6%, Ohio at 49.4%, Utah at 49.2%, Alaska at 48.8% and North Carolina at 48.4%.
 Click on graph for larger image.
This graph shows the daily (columns) and 7 day average (line) of positive tests reported.