“Bull markets are born on pessimism, grow on skepticism, mature on optimism and die on euphoria.” -Sir John Templeton
My macro process has three key steps: Price, Breadth and Sentiment. While most measures of price and breadth indicate the bull market is in decent shape, the third step of sentiment may be indicating an exhaustion of buyers and, therefore, limited upside.
Price tells you how investors are positioned based on the basic laws of supply and demand. Does demand outweigh supply? Then prices will go higher. If there is more supply than demand, then prices will go lower. Simple.
It’s actually not that simple, though, and the markets are indeed a complex system with many headwinds and tailwinds at any given moment! But price is price, and it indicates the aggregate supply and demand in the marketplace.
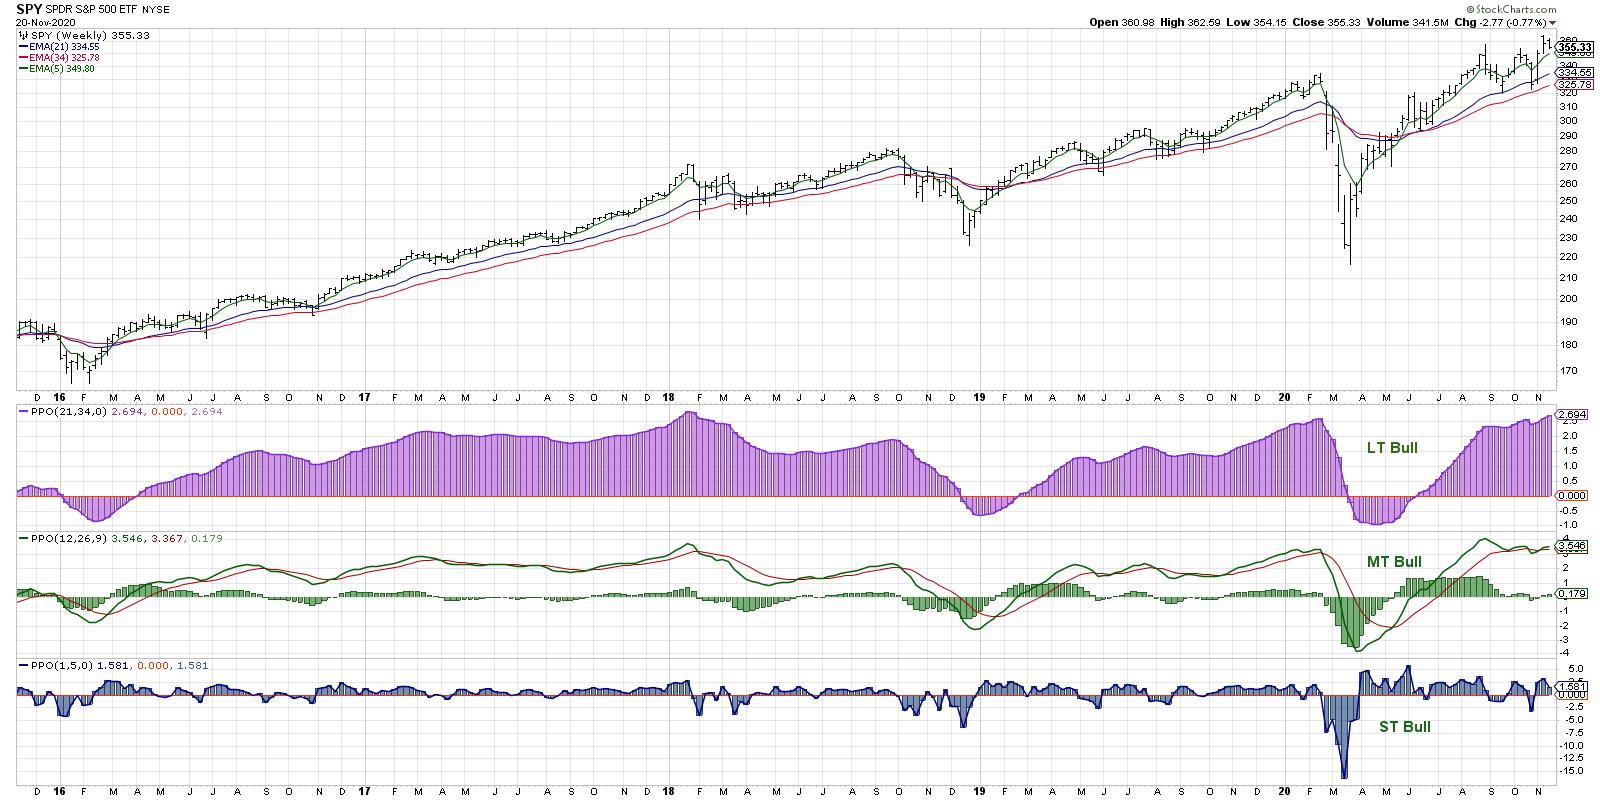
Even with the recent consolidation in the S&P 500, I still see a medium-term pattern of higher highs and higher lows. The market is in a confirmed uptrend.
Breadth speaks to participation. Improving breadth conditions mean the average stock is going higher, while deteriorating breadth conditions tell you more stocks are going lower than higher.
While breadth readings can tell you some information on their own, they are of much greater value when you compare price to breadth. If price is rising on improving breadth, that means that more stocks are participating in the uptrend and, therefore, it is more likely to continue. Prices rising on weaker breadth would suggest less stocks joining in the uptrend and is often associated with bull market tops.
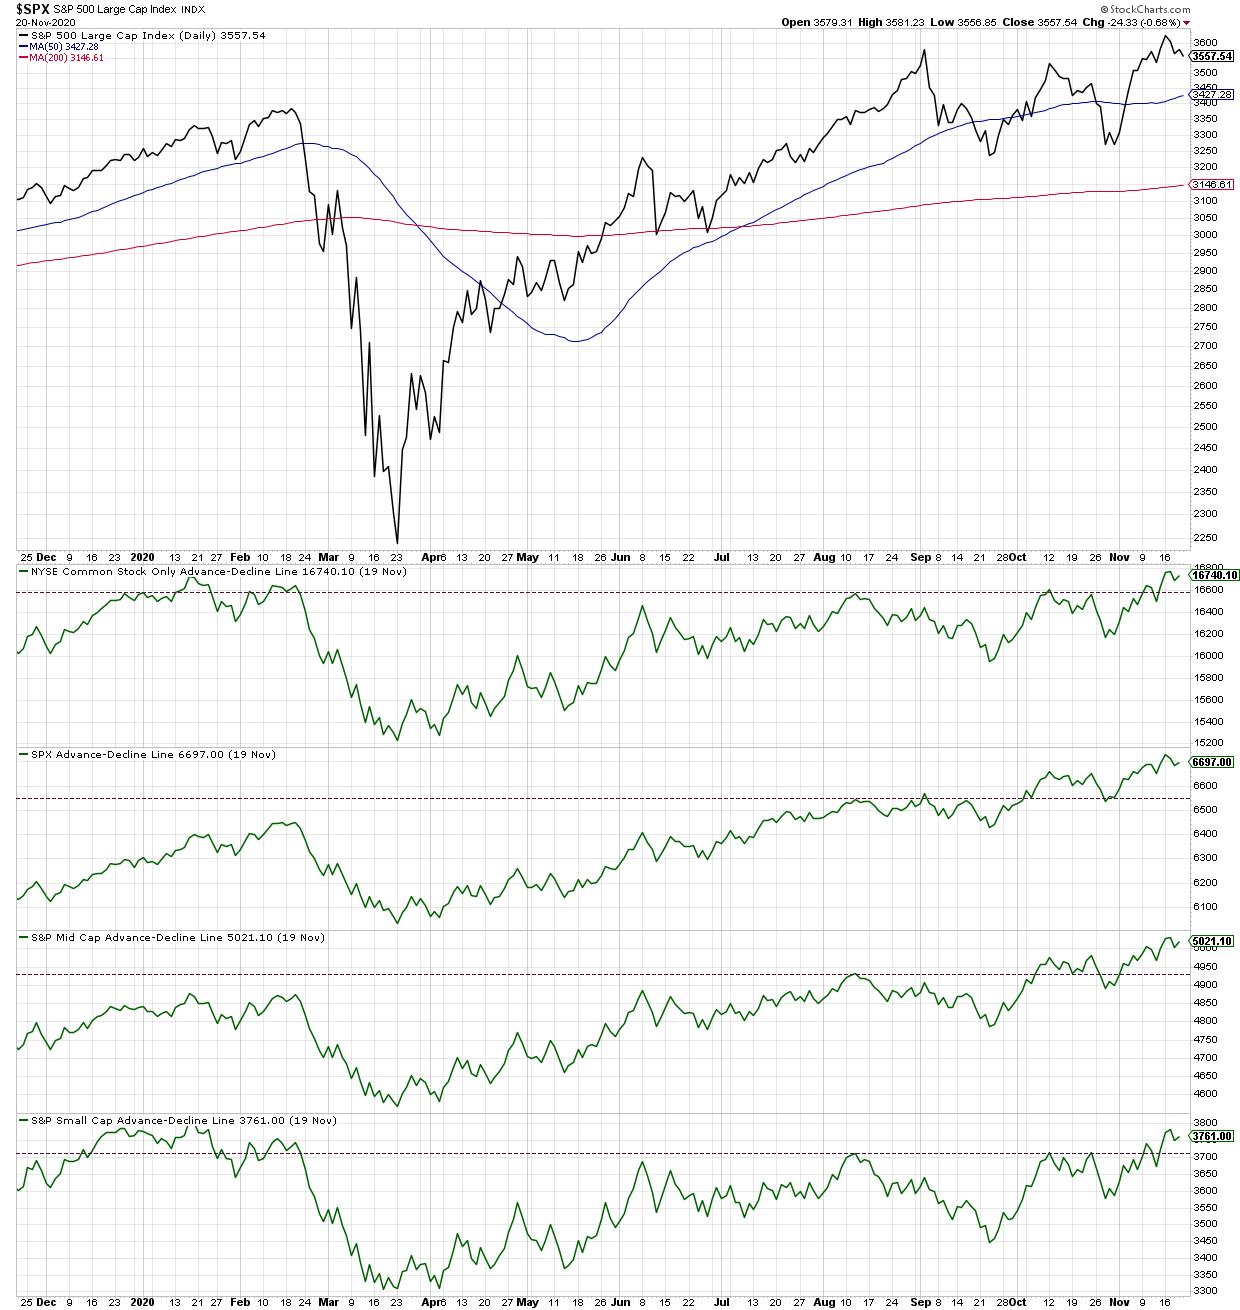
With the cumulative advance-decline lines for the S&P 500, S&P Mid Caps, S&P Small Caps and NYSE Common Stocks all making new highs in recent weeks, the breadth picture, at present, is supportive of the recent uptrend. Breadth is bullish here.
Now that brings us to the third step, which is sentiment. Here’s where John Templeton’s quote starts to resonate! When we say that “markets die on euphoria,” we are looking for indications that buyers are “all-in” and are bullish in their expectations and positioning.
While that seems like it should be a positive for stocks, the contrarian perspective would say that, if everyone is bullish and everyone has already bought in to the uptrend, who is left to push the market even higher?
Tom DeMark once told me that markets don’t top because of an influx of sellers – it’s because of an exhaustion of buyers. When no one is left to push the market higher, then price is most likely to go sideways to down.
This brings us to today’s chart, showing the NAAIM Exposure Index and the Rydex fund flows.
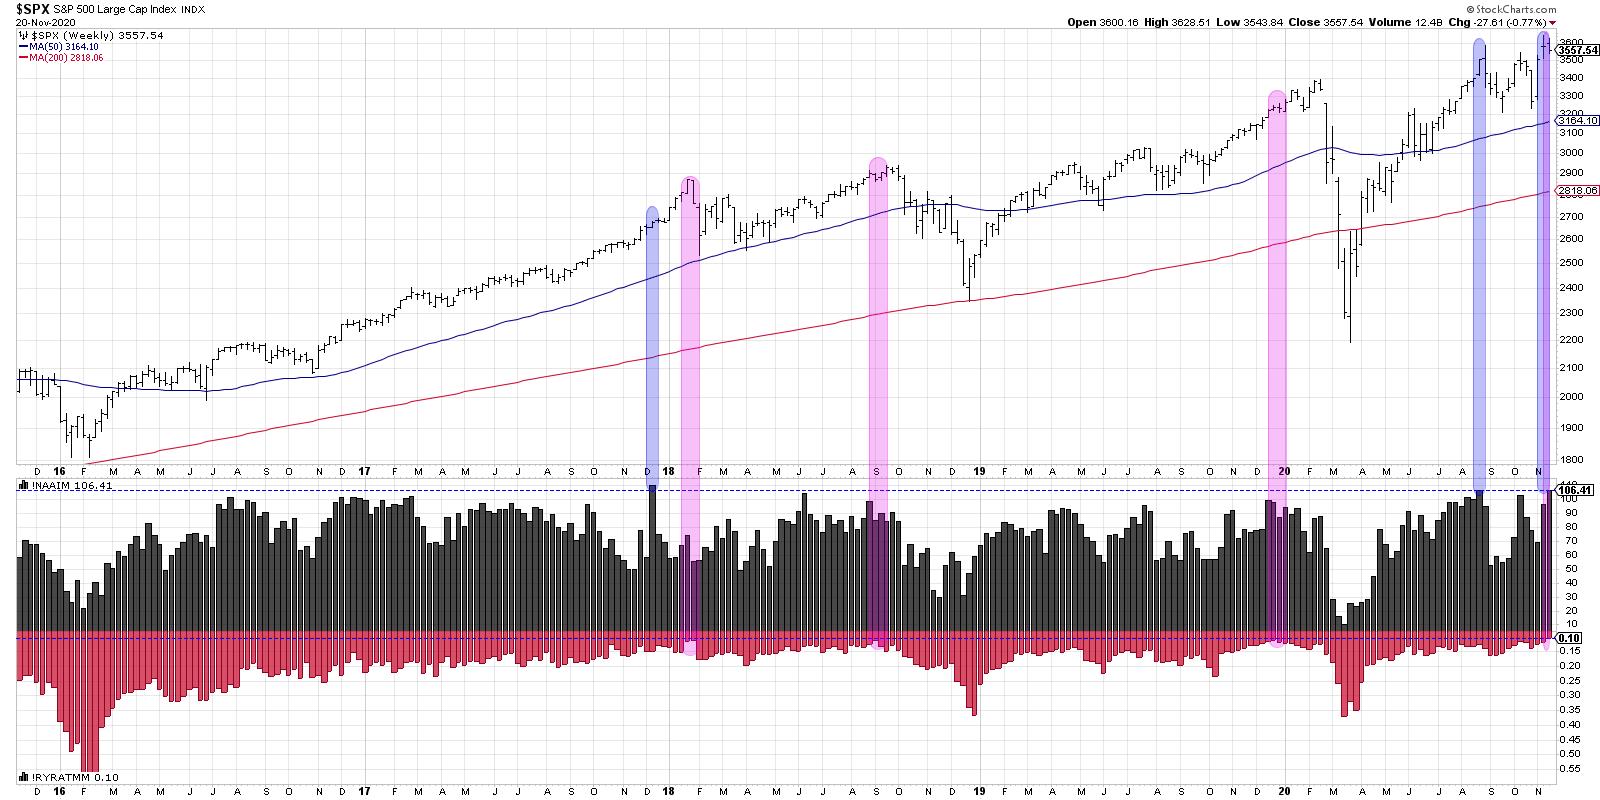
Here, we’re showing the S&P 500 index using weekly data. The lower panel includes the NAAIM Exposure Index in black and the Rydex fund flows in red.
The NAAIM Exposure Index shows weekly data measuring the equity allocation for members of the National Association of Active Investment Managers. The last two weeks have seen this indicator jump from about 70% equities to now 106% equities.
When were the last two times this allocation was over 100%? August 2020, just before the September peak, and December 2017, just before the January 2018 peak.
Rydex fund flows measure the assets in the bullish funds (long equities and sector funds) versus bearish funds (short equities and cash) in the Rydex family of funds. This ratio is charted inversely to line up better with price and the NAAIM Exposure Index.
Here, we can see that the current value of .1 is one of the lowest readings in history. The last three times we’ve neared this extreme low level (highlighted in pink) were December 2019, September 2018 and January 2018. The market topped out soon after each one of those occurrences.
The way market tops often play out begins with us seeing an extreme bullish sentiment reading. Check. Then we would often see some negative signals, perhaps a bearish divergence, that would suggest weaker breadth as the market moves higher. Nothing yet on that note. Finally, price itself would turn lower to validate all of the above.
Bull markets die on euphoria. By any measure I’m seeing right now, we are there.
RR#6,
Dave
David Keller, CMT
Chief Market Strategist
StockCharts.com
Disclaimer: This blog is for educational purposes only and should not be construed as financial advice. The ideas and strategies should never be used without first assessing your own personal and financial situation, or without consulting a financial professional.
The author does not have a position in mentioned securities at the time of publication. Any opinions expressed herein are solely those of the author, and do not in any way represent the views or opinions of any other person or entity.