Note
This is a copy of today’s DMR that I just sent to our members. I believe we’re setting up for a HUGE rally in Q4 and the current weakness will provide tremendous opportunities. In the very short-term, however, we need to get through the next 1-2 weeks as bearish seasonal tendencies kick in. Building cash and slowly deploying it to build a winning portfolio for the next few months makes great sense to me. If you’d like to receive my DMR daily and benefit from all of our products and services, including a Model Portfolio that has gained 132% (more than 100 percentage points higher than the benchmark S&P 500) in less than 2 years (!!!), CLICK HERE. We have a fully refundable, $7 30-day trial that I’d love for you to take advantage of!
Executive Market Summary
- Futures are very weak this morning and I’m not at all surprised given Wednesday’s finish
- NASDAQ futures are down approximately 2.25% this morning; Dow Jones slides 300+ points
- The S&P 500 attempted to clear gap resistance at 3426 on Wednesday and failed
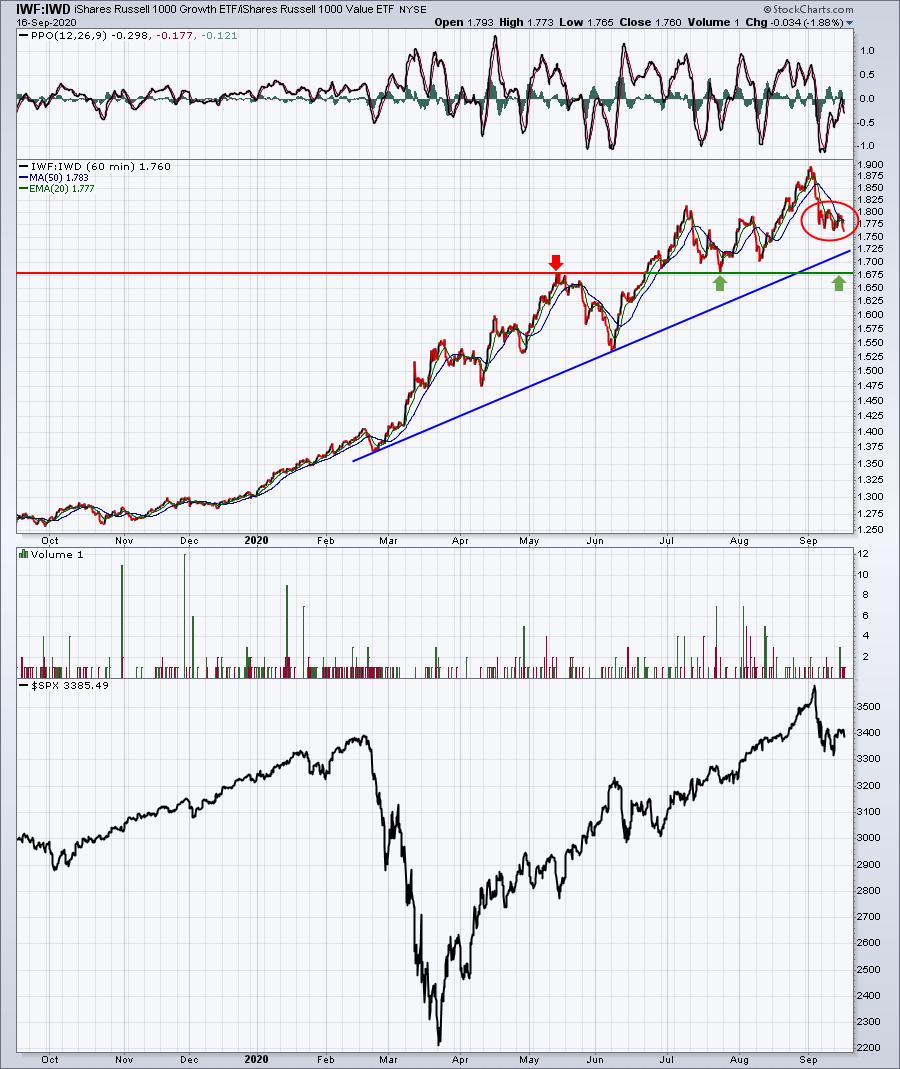
- Growth vs. value (IWF:IWD) closed at its lowest relative level in a month
- Energy (XLE) rallied more than 4% on Wednesday as crude oil ($WTIC) closed above $40 per barrel
- Financials (XLF) and industrials (XLI) also gained more than 1%, benefiting from a rising TNX
- The 10 year treasury yield ($TNX) climbed a basis point, despite a weaker-than-expected retail sales report
- Retail stocks (XRT) actually gained nearly 0.50% following a rough start to September
- Technology (XLK) and communication services (XLC) both lost more than 1% as computer hardware ($DJUSCR) and internet ($DJUSNS) were among the weakest industries
- Apple (AAPL) and Microsoft (MSFT) were among the Dow Jones’ biggest losers
Market Outlook
The market definitely took a turn for the worse yesterday, in my opinion. The Fed, which clearly announced it remains extremely dovish, delivered its policy statement at 2pm ET and the market initially rallied. The S&P 500 had its chance to clear gap resistance at 3426 – it hit an intraday high of 3428 – and then fell apart in the final 90 minutes. It just gave its chart a very bearish look:

That final 90 minutes on Wednesday painted a rather bearish short-term picture. I fully expect we’ll see RSI drop to a key 40 test, possibly even slightly below as the September blues work its way through U.S. equities.
Yesterday, there was one inaccuracy in the DMR. The IWF:IWD was actually weakening, not strengthening as indicated. This can be seen in the ratio’s one month low close:

1.68 to 1.72 on this ratio should provide the stock market a lot of support. Keep in mind that this simply tallies the ratio of growth stocks performance vs. value. If both groups go down the same percentage, this ratio doesn’t change. It only moves lower as a disproportionate amount of money rotates into value stocks. I believe if that rotation takes place and this ratio moves down closer to 1.70, the reward to risk begins to shift dramatically back towards growth stocks.
Trading in the short-term with rotation favoring value stocks will be difficult. It’s likely been difficult during September for many of you as it’s been tough for me as well. I’d suggest keeping things as light as possible for now. Remember that we’re approaching the worst time during September – the 21st through the 27th. I believe things will set up nicely for another pre-earnings advance in October, but we can’t force the issue too early. From a longer-term perspective, this weakness will present a nice opportunity to build portfolios for likely Q4 strength. I remain quite optimistic in that regard.
If I’m correct about the IWF:IWD ratio weakening further, it’ll likely have a near-term negative impact on our portfolios. Please remember that we develop those with a buy-and-hold mentality (well, for three months). Trade them however you wish, but our results will reflect the buy-and-hold approach.
Sector/Industry Focus
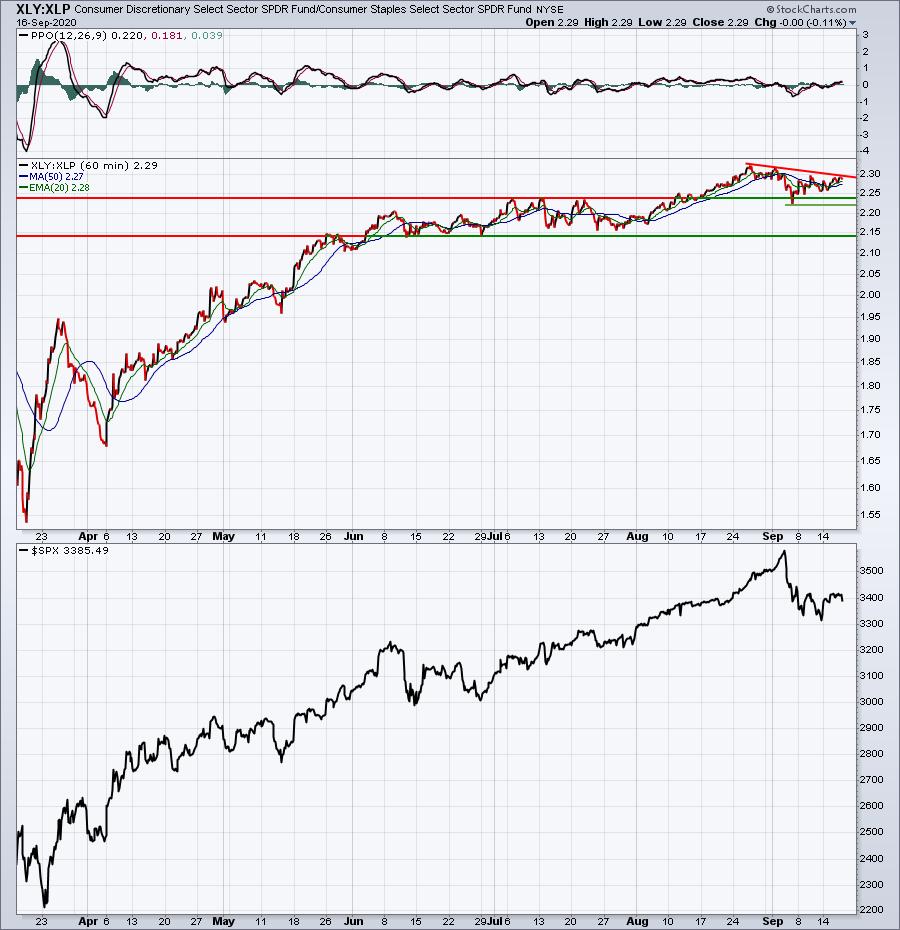
The IWF:IWD isn’t the only ratio that’s been turning more bearish during September. The consumer stock ratio that I follow closely – discretionary vs. staples (XLY:XLP) – has also been downtrending during September, though it hasn’t given up a lot of ground. Check it out:

The XLY:XLP ratio has held up fairly strong, but I wouldn’t be surprise to see another move lower. I’ve provided a few key levels of support along the way, with the biggest being near 2.15. That was the relative low tested multiple times back in June and July.
ChartLists
I’d use the next 1-2 weeks to scour our ChartLists, especially our Strong Earnings ChartList to look for strong stocks (SCTRs >90) that have established very strong support levels. For example, consider a stock like DOCU:

I don’t have a crystal ball to know exactly how far DOCU might drop, but the 180-190 area should provide at least some support. DOCU will very likely see a lot of buyers as it approaches its next earnings report, but between now and then, we could see additional shakeout of those that chased at close to 300. Listen, DOCU is a tremendous company with a very bright future, but the stock market is a painful lesson in human psychology sometimes. It can make us think that a company has no future at all, and just when you give up on it, its absolute and relative strength returns.
The Fed yesterday told us that there are likely to be no rate hikes for the next 3 years. If that’s true, and our economy strengthens and company profits grow, I believe we’ll see a MASSIVE bull market run higher. The deficit won’t matter. It won’t matter who’s in the White House. Another round with the virus this winter won’t matter. It just won’t matter.
Secular bull markets run their course in the face of adversity. We’ve seen it with the trade war. We’ve seen it with the 100-year pandemic. What’s next? Bring it on.
If our paid service isn’t your thing right now, no problem. You can join our free EB Digest newsletter, published 3x per week, without a credit card. Plus, you can unsubscribe at any time. JOIN HERE!
Earnings Reports
Here are the key earnings reports for the next two days, featuring stocks with market caps of more than $10 billion. I also include a few select companies with market caps below $10 billion. Finally, any portfolio stocks that will be reporting results are highlighted in BOLD. If you decide to hold a stock into earnings, please understand the significant short-term risk that you are taking. Please be sure to check for earnings dates for any companies you own or are considering owning.
Thursday, September 17:
CMD
Friday, September 18:
None
Economic Reports
August housing starts: 1,416,000 (actual) vs. 1,486,000 (estimate)
August building permits: 1,470,000 (actual) vs. 1,530,000 (estimate)
Initial jobless claims: 860,000 (actual) vs. 850,000 (estimate)
Philadelphia Fed Manufacturing Index: 15.0 (actual) vs. 15.5 (estimate)
Happy trading!
Tom