Semiconductors ($DJUSSC) opened 2023 with a BANG! They spent the entire month of February and the first two weeks of March consolidating in a bullish ascending triangle pattern, but today we’re either going to get a confirmed breakout or a false breakout. It simply depends on where we close:
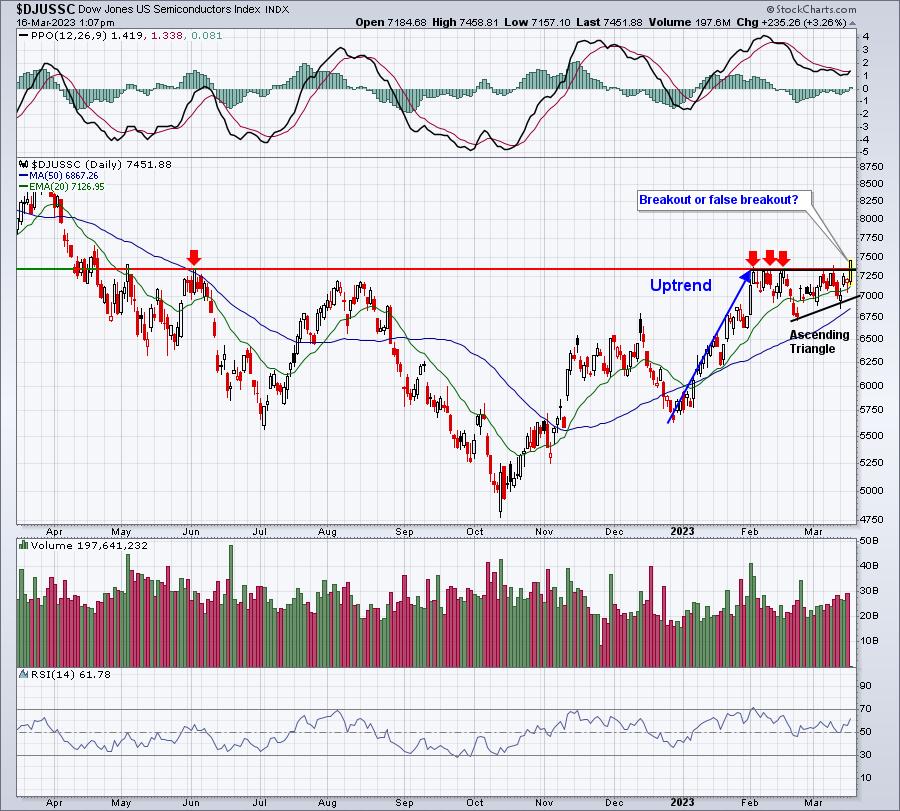
Notice that the daily RSI has remained almost exclusively in the bullish 40-70+ range since October. That’s a signal that semiconductors are trending higher. Clearly, the price chart is confirming it.
What’s important to understand about semiconductors moving higher, though, is that such relative strength typically accompanies a move higher in the S&P 500. Check out this chart and look at the positive correlation in the bottom panel:
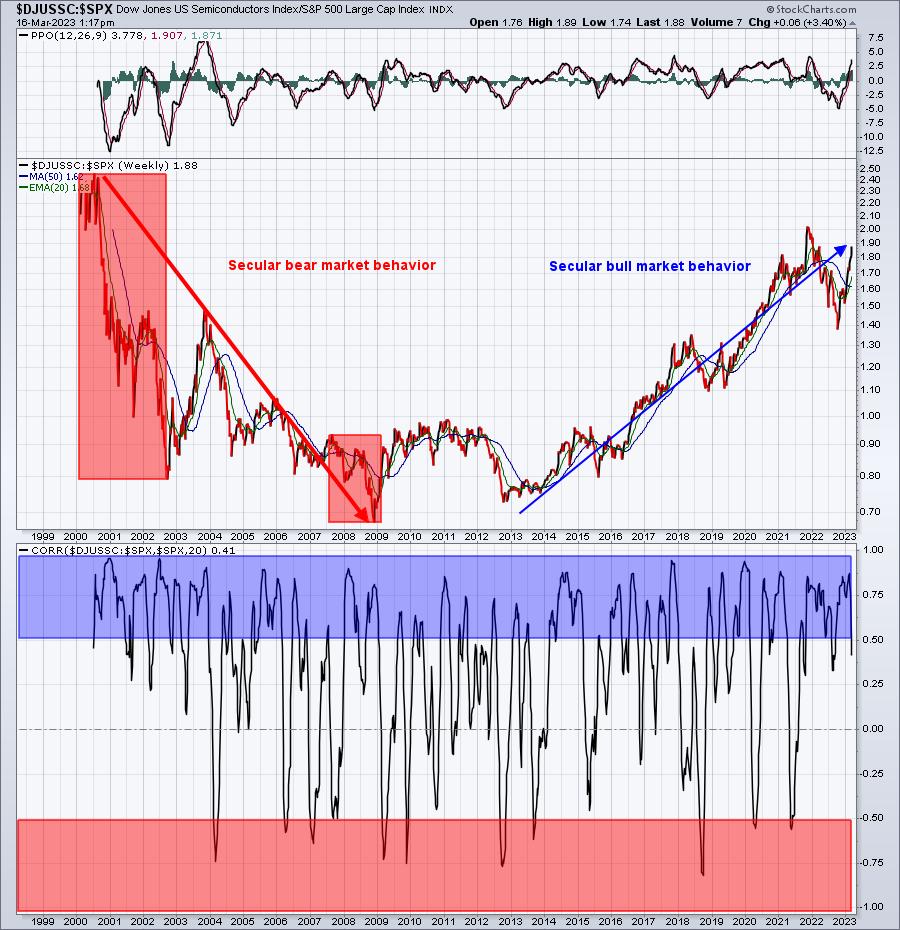
I’ve highlighted the positive correlation region above 0.50 in blue and the negative (or inverse) correlation region below -0.50 in red. Check out how often these two areas are reached. There is VERY strong positive correlation between the relative strength in semiconductors and the direction of the S&P 500.
We’ve been guiding our EarningsBeats.com members through a very difficult market environment the past few years via research like the above. Listening to all the bearishness on CNBC serves no purpose, other than entertainment. Follow the charts, improve your odds, and build your financial worth. Check us out at EarningsBeats.com. CLICK HERE to start a FREE 30-day trial and get a leg up on Wall Street.
Happy trading!
Tom Bowley, Chief Market Strategist, EarningsBeats.com