For manufacturing, the Industrial Production report will be released.
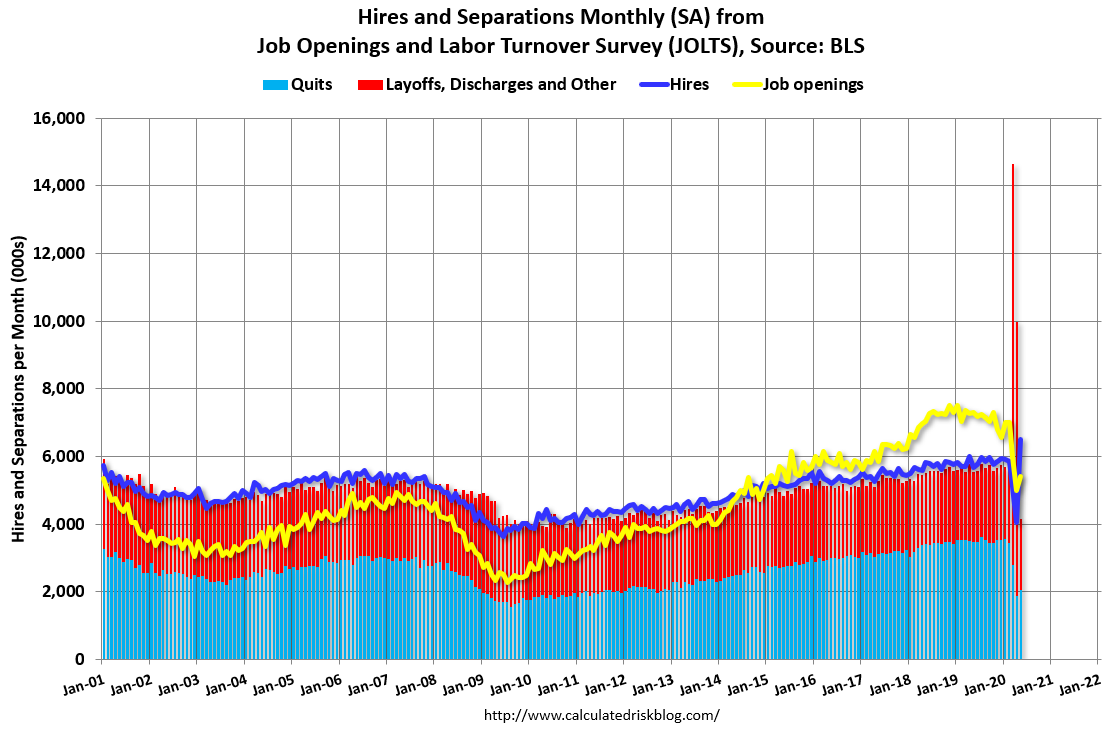 10:00 AM ET: Job Openings and Labor Turnover Survey for June from the BLS.
This graph shows job openings (yellow line), hires (purple), Layoff, Discharges and other (red column), and Quits (light blue column) from the JOLTS.
Jobs openings increased in May to 5.397 million from 4.996 million in April.
The number of job openings (yellow) were down 26% year-over-year, and Quits were down 41% year-over-year.
6:00 AM ET: NFIB Small Business Optimism Index for July.
8:30 AM: The Producer Price Index for July from the BLS. The consensus is for a 0.3% increase in PPI, and a 0.1% increase in core PPI.
12:00 PM: MBA Q2 National Delinquency Survey
7:00 AM ET: The Mortgage Bankers Association (MBA) will release the results for the mortgage purchase applications index.
8:30 AM: The Consumer Price Index for July from the BLS. The consensus is for a 0.3% increase in CPI, and a 0.2% increase in core CPI.
8:30 AM: The initial weekly unemployment claims report will be released. The early consensus is for a 1.100 million initial claims, down from 1.186 million the previous week.
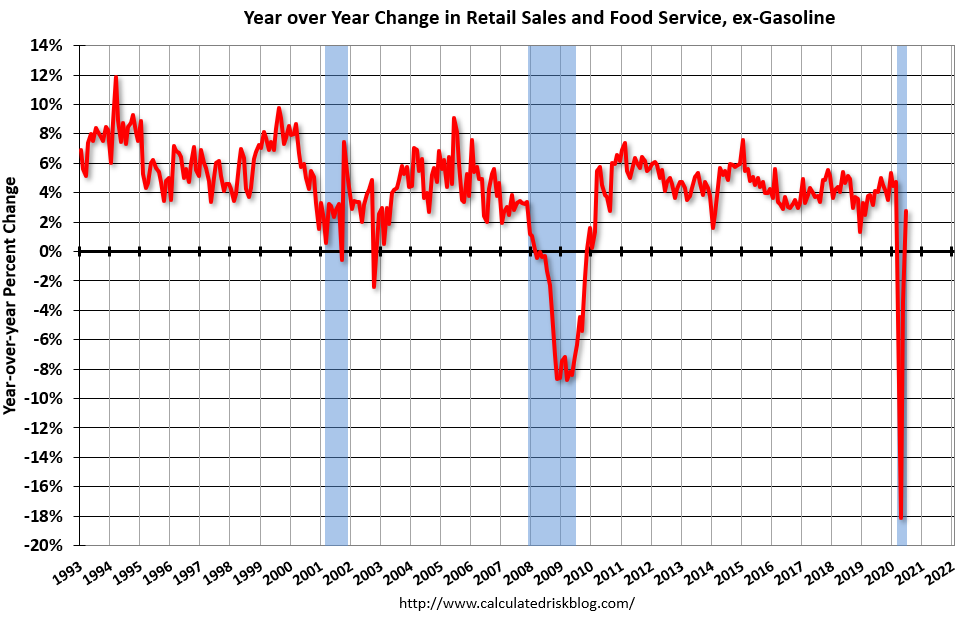 8:30 AM: Retail sales for July is scheduled to be released. The consensus is for 1.8% increase in retail sales.
This graph shows the year-over-year change in retail sales and food service (ex-gasoline) since 1993. Retail and Food service sales, ex-gasoline, increased by 2.7% on a YoY basis.
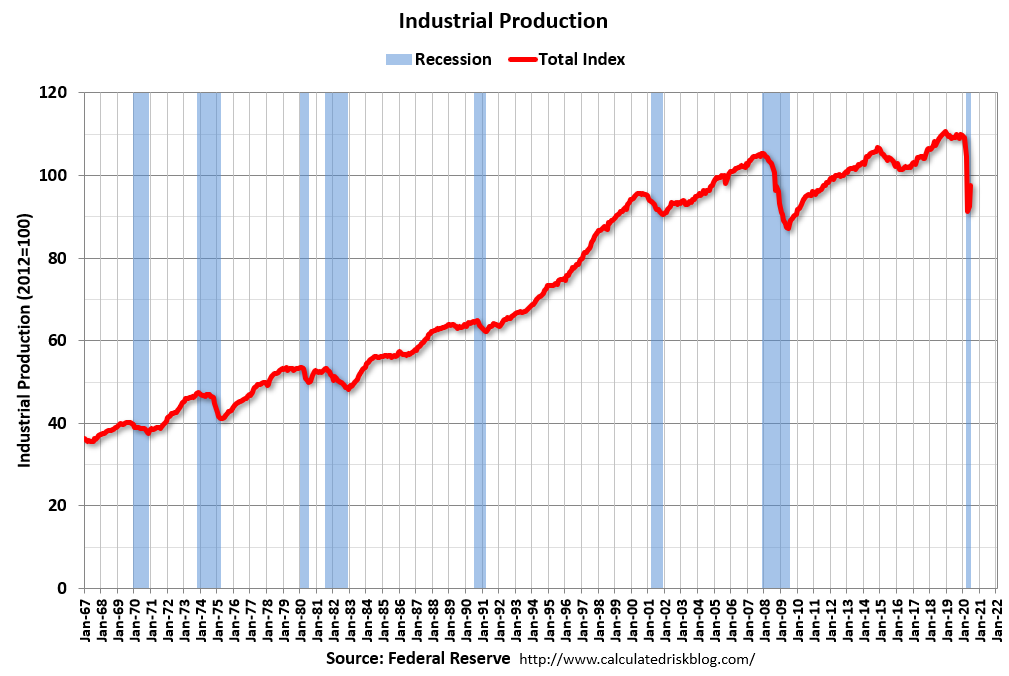 9:15 AM: The Fed will release Industrial Production and Capacity Utilization for July.
This graph shows industrial production since 1967.
The consensus is for a 3.0% increase in Industrial Production, and for Capacity Utilization to increase to 70.2%.
10:00 AM: University of Michigan’s Consumer sentiment index (Preliminary for August).