 RSI is widely used as a momentum oscillator to identify overbought and oversold levels. A dive into the formula, however, reveals that RSI is quite well equipped for trend-following strategies. It can even be used to rank ETFs and stocks to find those with the strongest momentum.
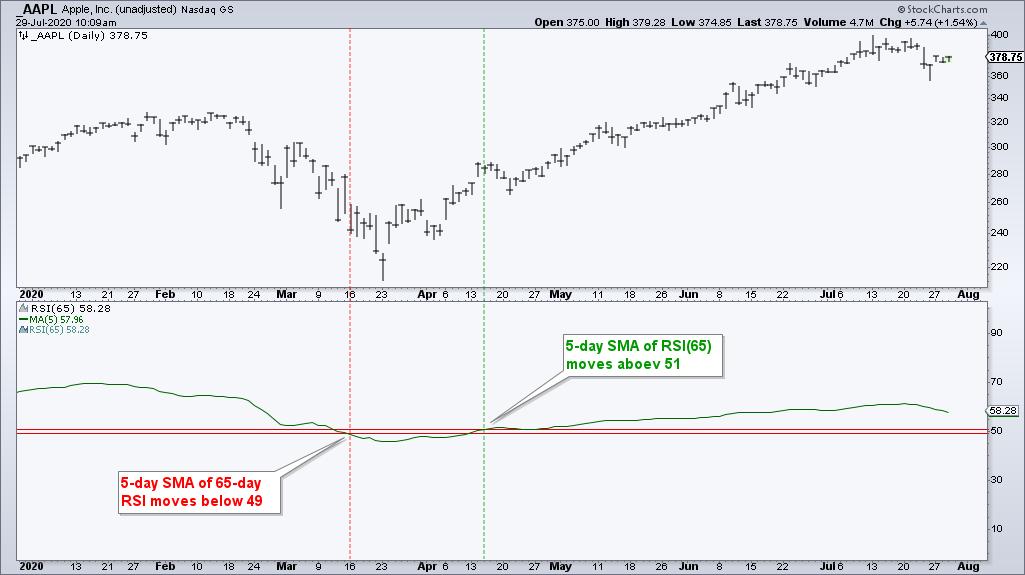
The strategy basically buys when the 5-day SMA of 65-day RSI crosses above 51. We will call this “Smoothed RSI65”. The green line in the indicator window is Smoothed RSI65. Note that RSI(65) is invisible. Smoothed RSI65 moved above 51 in mid April for a bullish trend signal. A bear signal would trigger with a move below 49.
There are plenty of great examples over the last few months, but how did this strategy perform over the last twenty years? Well, I tested this strategy and will be adding some articles and videos to TrendInvestorPro.com in the coming weeks. In the meantime, I am presenting this strategy to the CMT Association today at noon ET (click here). The presentation starts with an overview of RSI and then examines the main driver for RSI values. I will then build out a trend-following strategy and backtest this strategy using stocks in the S&P 500.
Hope to see you there!
Click here to take your analysis process to the next level – TrendInvestorPro!
——————————————