The Apartment Vacancy Rate was unchanged in the second quarter but increased 0.2% from a year ago; Asking and Effective Rents declined 0.4% in the quarter after rising as much in the first quarter.
The Office Vacancy Rate rose 0.1% as occupancy declined by 977,000 square feet; the Average Office Asking Rent declined 0.1% while the Effective Rent declined 0.4% in the quarter.
The Retail Vacancy Rate was unchanged in the quarter at 10.2% despite a decline in occupancy of 1.125 million square feet; the Average Asking Rent declined 0.5% while the Average Effective Rent fell 0.6%. Mall statistics have not been finalized.
The commercial real estate statistics listed above represent an average of 79 metros, except for the retail statistics which cover 77 metros.
The metro results varied widely, although the changes were modest given the national pandemic’s shutdown measures which had a deep impact on job losses. The more moderate declines in commercial occupancy and rents were likely due to both the multi-year term structure of leases in office and retail, as well as to the Paycheck Protection Program and CARES Act which allowed most tenants to pay their rent.
…
ConclusionThe second quarter statistics clearly show that property owners have yet to feel the full impact of the pandemic. In fact, demand for apartments could hold steady in most metros …
The lack of response in the retail sector was especially striking given that many retailers were already suffering from diverted e-commerce sales even before the coronavirus struck. While many retailers have re-opened in the last month, many may not survive a second wave of the virus that has crippled economies in much of the south and west.
Finally, the office market may have seen the slightest impact, but this was likely due to the 5-to-15-year term structure of leases that kept the market intact. Still, the forced work-from-home option driven by the pandemic has prompted many office planners to reconsider future office needs which will impact the office market for years.
 Click on graph for larger image.
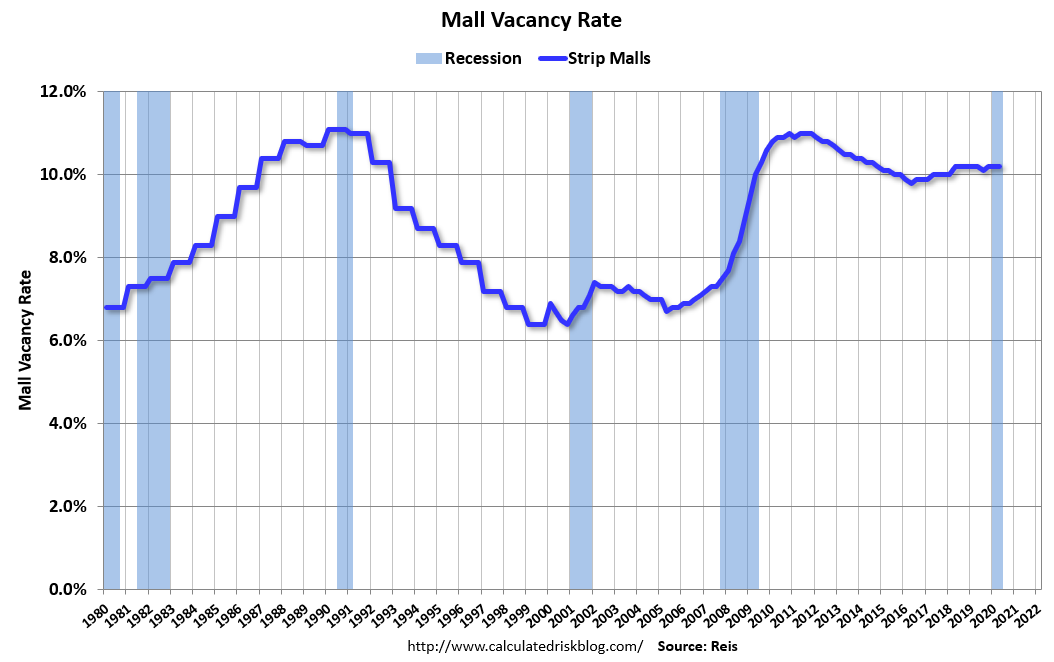
This graph shows the strip mall vacancy rate starting in 1980 (prior to 2000 the data is annual).
For Neighborhood and Community malls (strip malls), the vacancy rate was 10.2% in Q2, unchanged from 10.2% in Q1, and unchanged from 10.2% in Q2 2019.
For strip malls, the vacancy rate peaked at 11.1% in Q3 2011, and the low was 9.8% in Q2 2016.
Recently the regional mall vacancy rates have increased significantly from an already elevated level, however Reis didn’t release the regional mall vacancy data for Q2.
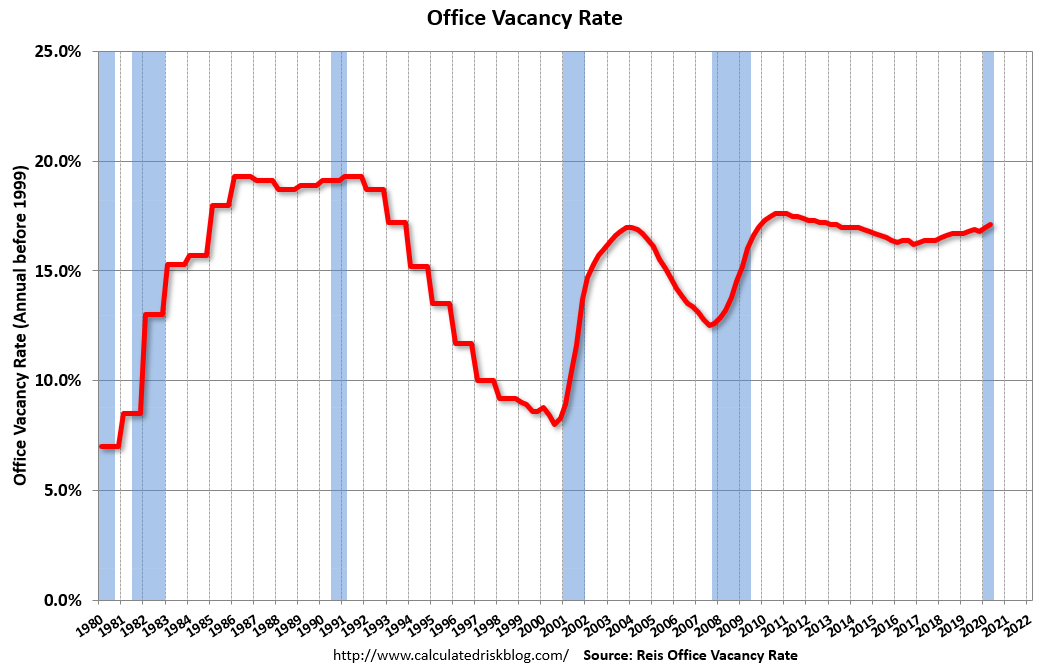 This graph shows the office vacancy rate starting in 1980 (prior to 1999 the data is annual).
Reis reported the vacancy rate was at 17.1% in Q2, up from 17.0% in Q1, and up from 16.8% in Q2 2019. The office vacancy rate had been mostly moving sideways at an elevated level, but has increased over the last two years. And will likely increase further as leases expire.
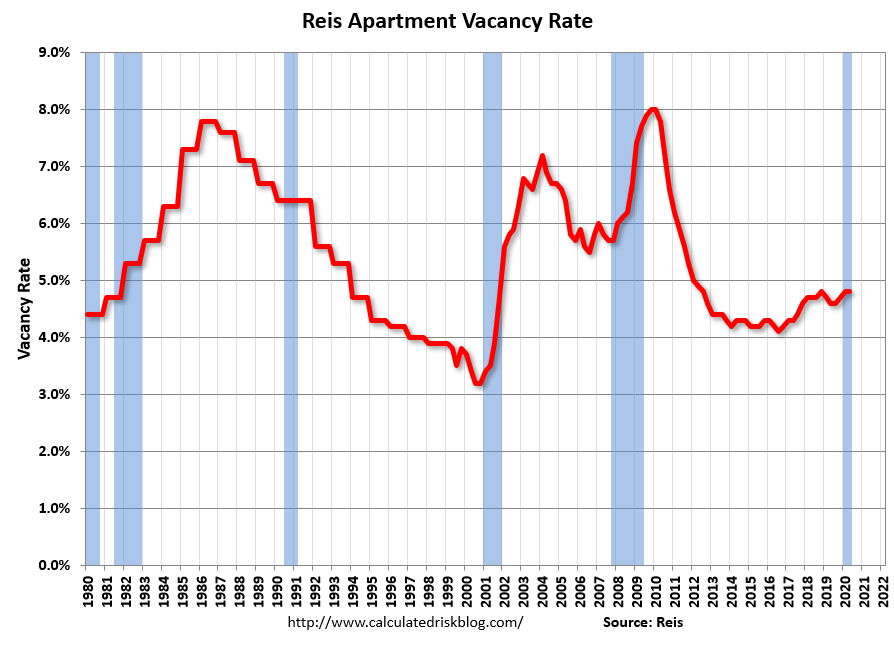 This graph shows the apartment vacancy rate starting in 1980. (Annual rate before 1999, quarterly starting in 1999). Note: Reis is just for large cities.
Reis reported the vacancy rate was at 4.8% in Q2, unchanged from Q1, and up from 4.6% in Q2 2019.
The apartment vacancy rate will probably stay fairly low if there is additional disaster relief. However, the vacancy rate could increase sharply if the eviction moratoriums end and there is minimal additional disaster relief.
All vacancy data courtesy of Reis