
In my article for last weekend’s ChartWatchers newsletter I wrote about a set of ETFs representing small-cap sectors and how they can be used in a Relative Rotation Graph. I also talk about it in this week’s episode of Sector Spotlight.
The crux is that looking at the market from this angle can give you more insight and potential (trading) ideas that may otherwise escape your attention.
Today I am going to put one of these observations into action in the RRG Long/Short basket.
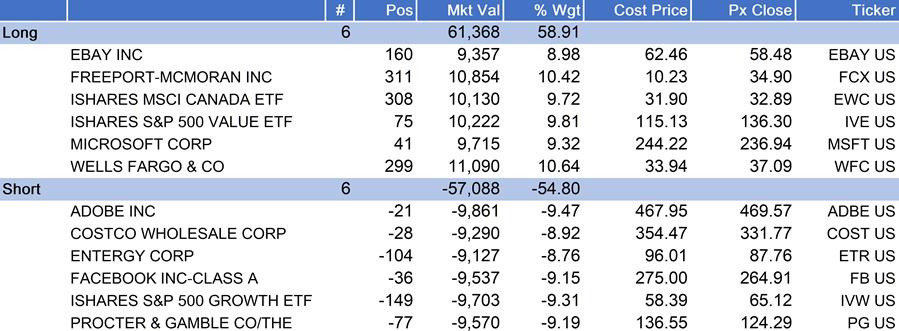
The table below shows the current positions after the rebalancing as described in this article.
For a quick analysis of these positions I put them in a Relative Rotation Graph to quickly gauge whether they are still behaving as expected.
LONG

The table below the chart shows the performance for the members over the last five weeks. Only EBAY and MSFT are below SPY and underperforming.
Their tails are inside improving and heading towards the leading quadrant. The price charts are not the best but they still have the possibility to turn around so I am keeping things as they are.
SHORT
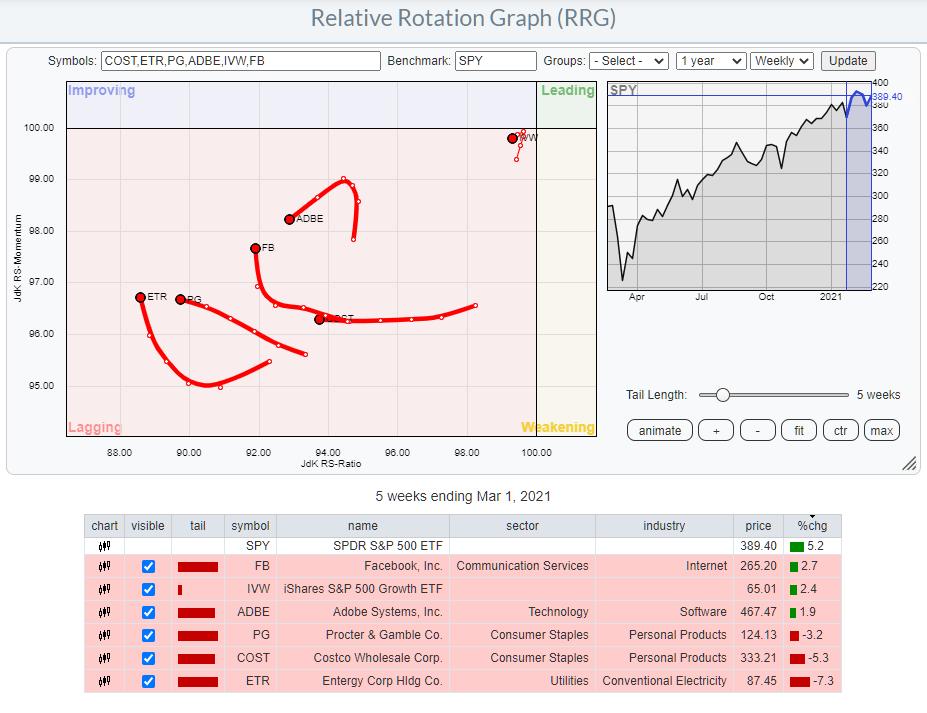
The RRG showing the short side of the basket indicates that all are on track. Over the last five weeks all positions have underperformed SPY and as you can see, all the tails are well inside the lagging quadrant and moving lower on the JdK RS-Ratio scale. Albeit only marginally for FB.
Adding PSCD vs XLY
The way I am using the two sets of sector ETFs, SPDRs for large caps and the Invesco family for small-caps, is to look for differences. When tails for both small- and large-caps are moving in a similar direction it means that their performance characteristics are largely the same. And that means that there is no distinctiveness that we can capture.

If we start with the RRG that shows Large-, Mid-, and small-caps against the Dow Jones US index we can easily see that small-caps are way further to the right inside leading while large-cap is inside lagging. This is a clear message in favor of small-caps.
The counter-trend move on the JdK RS-Momentum scale is not worrisome at this moment and is more an indication of a temporary counter-trend rotation within the longer-term up-move.
This observation means that we should be looking for tails that are moving at a strong heading inside or towards the leading quadrant on the small-caps RRG. While we need to spot tails at a negative heading towards or into the lagging quadrant on the large-cap RRG.
This ensures that we are picking a strong small-cap sector for a potential long position and a weak large cap-sector for a potential short position.
This comparison in itself is already a valuable addition to our analytical toolbox but when it happens within the same sector we have a double whammy…. In a good way.
And that is exactly what is happening with the Consumer Discretionary sector.
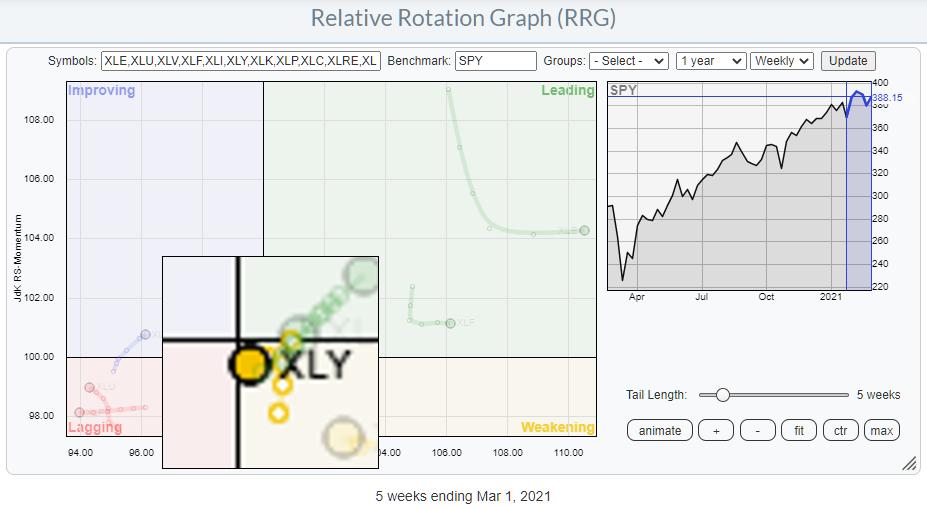
On the Large cap RRG, XLY has just turned left and instead of rotating back into the leading quadrant, the tail is now close to crossing over into lagging.
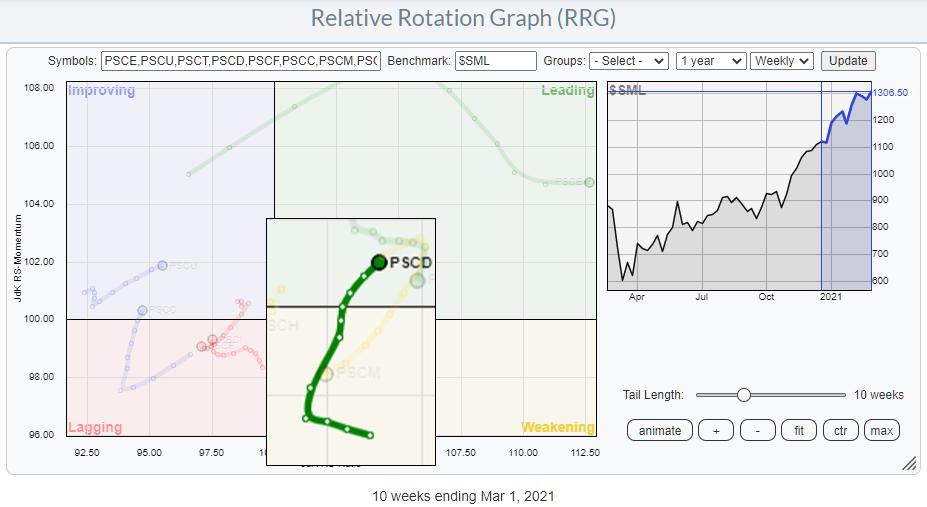
The tail on the small cap RRG shows a very different rotation. Much higher on the RS-Ratio scale, PSCD has just rotated back into the leading quadrant, signalling a new up-leg in the relative uptrend has just started.
Adding PSCD vs XLY to the basket
So from a Long-Short perspective I am adding PSCD to the long side of the basket, and XLY to the short side of the basket in an attempt to capture the difference between the two instruments while remaining agnostic to general market direction.
#StaySafe, –Julius