The CDC is the source for all data.
According to the CDC, on Vaccinations. Total doses administered: 400,669,422, as of a week ago 393,756,866, or 0.99 million doses per day.
| COVID Metrics | ||||
|---|---|---|---|---|
| Today | Week Ago |
Goal | ||
| Percent fully Vaccinated | 56.3% | 55.7% | ≥70.0%1 | |
| Fully Vaccinated (millions) | 186.9 | 184.9 | ≥2321 | |
| New Cases per Day3 | 93,605 | 106,447 | ≤5,0002 | |
| Hospitalized3 | 62,456 | 72,704 | ≤3,0002 | |
| Deaths per Day3 | 1,421 | 1,554 | ≤502 | |
| 1 Minimum to achieve “herd immunity” (estimated between 70% and 85%). 2my goals to stop daily posts, 37 day average for Cases, Currently Hospitalized, and Deaths 🚩 Increasing 7 day average week-over-week for Cases, Hospitalized, and Deaths ✅ Goal met. |
||||
IMPORTANT: For “herd immunity” most experts believe we need 70% to 85% of the total population fully vaccinated (or already had COVID).
KUDOS to the residents of Vermont that have achieved 70% of total population fully vaccinated: Vermont at 70.1%.
KUDOS also to the residents of the 13 states and D.C. that have achieved 60% of total population fully vaccinated: Connecticut at 69.3%, Maine, Rhode Island, Massachusetts, New Jersey, Maryland, New York, New Mexico, New Hampshire, Washington, Oregon, Virginia, District of Columbia and Colorado at 60.0%.
The following 21 states have between 50% and 59.9% fully vaccinated: California at 59.7%, Minnesota, Hawaii, Pennsylvania, Delaware, Florida, Wisconsin, Texas, Nebraska, Iowa, Illinois, Michigan, Kentucky, South Dakota, Arizona, Kansas, Nevada, Alaska, Utah, North Carolina and Ohio at 50.8%.
Next up (total population, fully vaccinated according to CDC) are Montana at 49.0%, Indiana at 48.9%, Missouri at 48.5% and Oklahoma at 48.3%.
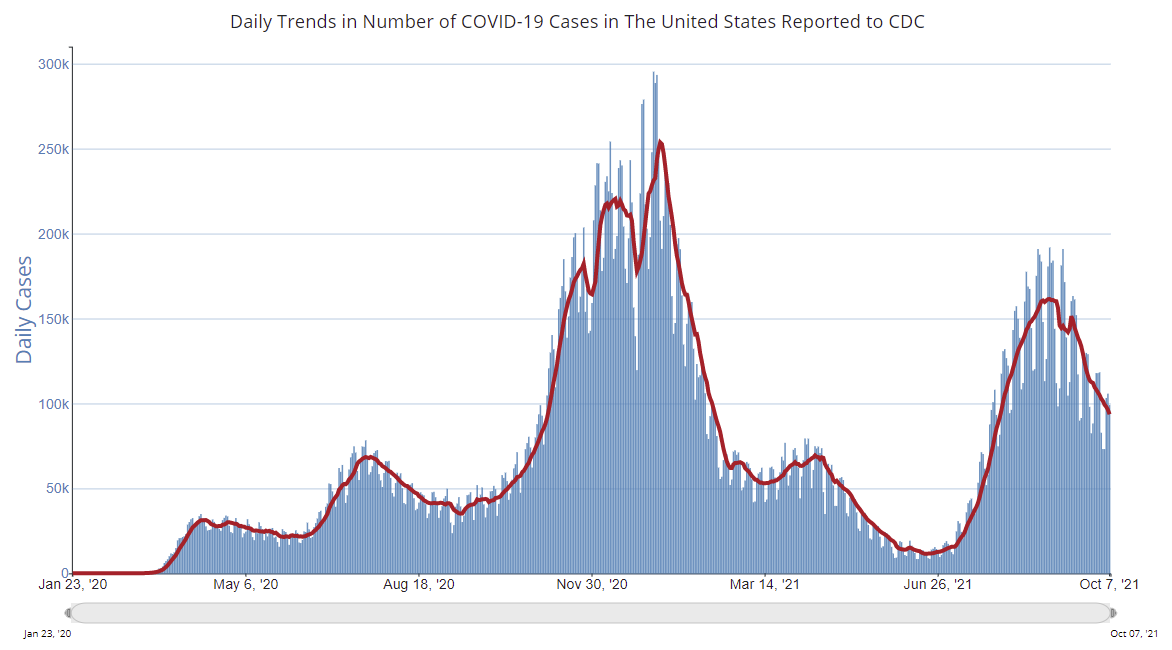 Click on graph for larger image.
This graph shows the daily (columns) and 7 day average (line) of positive tests reported.