Note: None of the markets, ETFs or stocks listed in this article are recommendations to buy or sell. This article is intended for educational purposes only.
In this article, we’ll look at a current Parallel Trend Channel pattern seen on the Daily chart of NASDAQ. Before we proceed, I think this statement from the 1935 book Profits in the Stock Market, by H.M. Gartley, is worth consideration:
“Trend Lines Not Infallible – A Treacherous Working Tool Unless Used with Common Sense
“A study of trend lines over many years shows that this working tool does not give uniformly accurate indications. It must be used as one of several aids which help the technical student to reduce guesswork as far as possible. Experience will teach the great value of this tool, however, if deductions are made cautiously.”
Trend lines, in my opinion, are a valuable tool in technical analysis, but, as Gartley points out, experience and combining other tools and common sense are needed. It is a tool that can look brilliant on its own in hindsight; however, working with trend line channels in real time can often yield false signals and breakouts. Redrawing trend line channels is common when using these patterns.
The value in studying and using trend lines lies in these areas: identifying trend reversals, risk management, entry points and target areas.
Trend channels also commonly form AB=CD patterns within the channel (see Chart 2), which are in and of themselves a type of trend channel, as we can see illustrated in Chart 1.
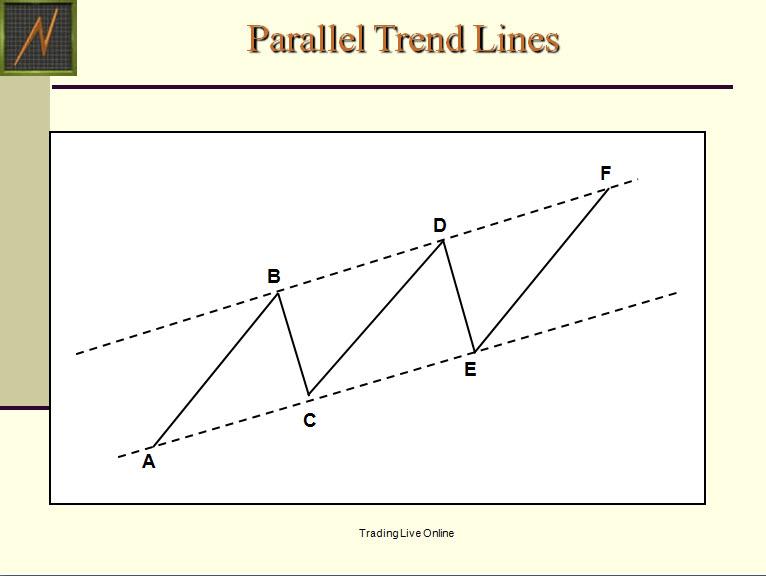 Chart 1 – Parallel Trend Lines forming AB-CD Sell Pattern
The upper dashed line in Chart 1 is the supply line, while the lower dashed line is the demand line. The theory is that traders can buy as price approaches the lower end of the trend line and sell as price approaches the upper end of the trend line. Of course, considering the overall market environment, longer-term trend analysis is vital.
The theory also suggests that, if the lower trend line is broken (in an up trending channel), that is a sell signal and potential trend reversal, whereas if the upper trend line is broken (in a downward-trending channel), that is a sell signal.
It’s also important to know and study a signal that can occur with an upside breakout of an upward-trending channel and a downside breakout of a downward trending channel. These can be extremely accelerating and fast moves, but be aware that price could also be signaling an end to that move in the near future as these are very emotional types of price movements.
Now that we have covered some basics of Parallel Trend Channels, let’s study Chart 2 of the NASDAQ.
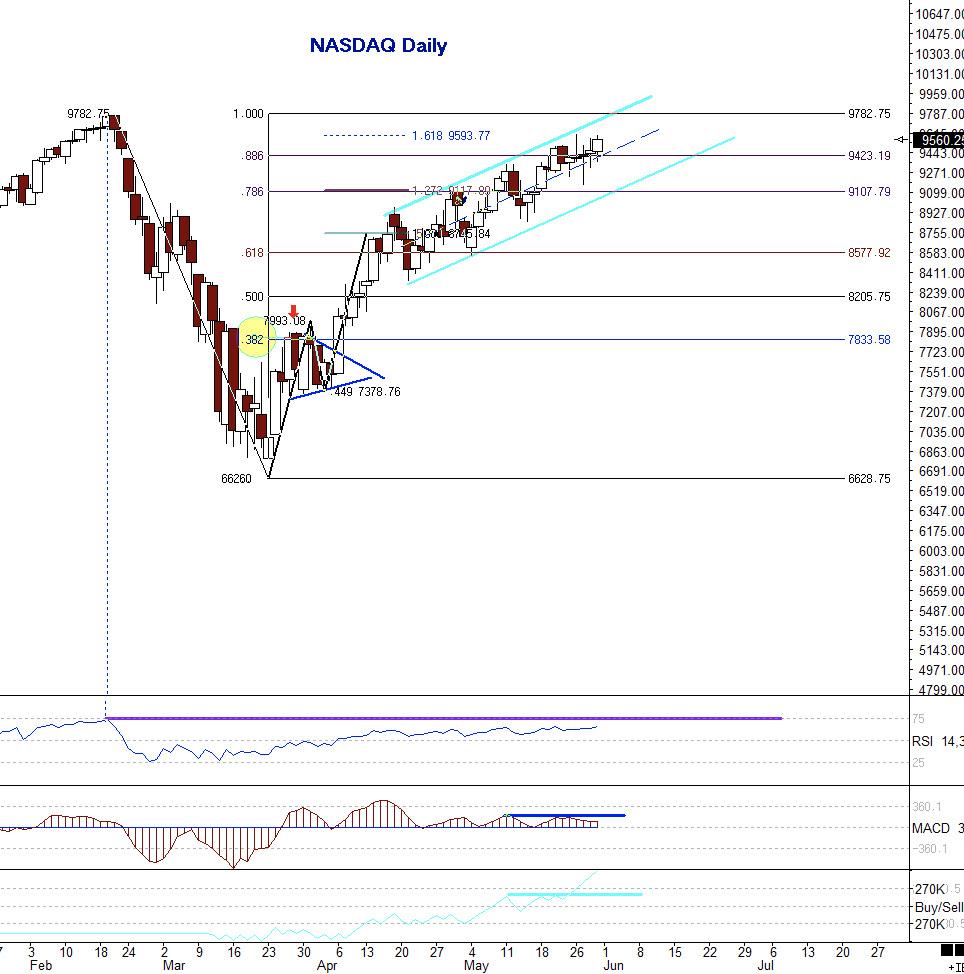 Chart 2 – NASDAQ Daily Parallel Trend Line Channel
NASDAQ is approaching the highs from February 2020 prior to the steep decline into March 2020. We can see a well-defined Parallel Trend Channel in the price ascent since mid-April 2020. (Note also the ABCD sell pattern formed within this channel that completed mid-May 2020 and reversed back towards the lower demand line.)
The previous high in this Parallel Trend Line Channel is 9604, which was made on May 26, 2020, June Futures. The high from February 2020 is 9782.75. The price level around the upper trend line, with another push up in price, is in the area of the AB=CD sell pattern shown in Chart 3.
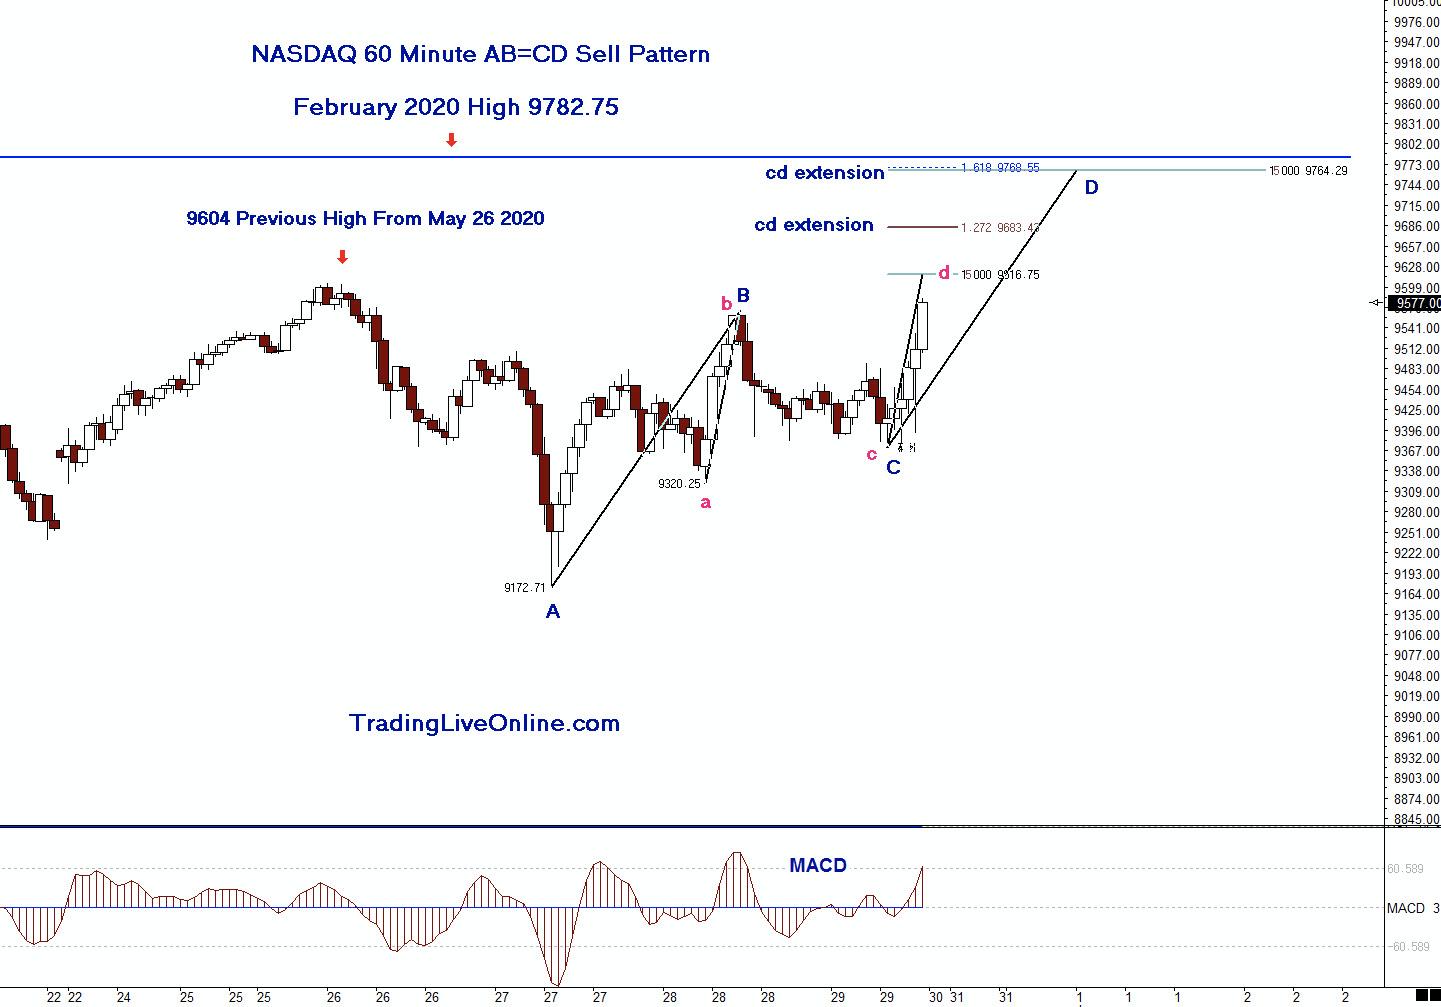 Chart 3 – Potential AB=CD Sell Pattern completing around Upper Parallel Trend Line Channel
Keeping in mind the above information we covered, let’s look at a potential pattern forming on the 60-minute time frame, Chart 3. If NASDAQ is testing the previous highs from February, then the expectation based on these AB=CD patterns forming is for a potential “play” around that level, rather than a straight-up shot through it. But, as we know, anything can happen.
Chart 3 shows two potential AB=CD patterns near the completion areas. Please note the “cd” extension areas. This is when the CD leg extends to a longer length than the AB leg. Refer to the book Trade What You See: How to Profit from Pattern Recognition, written by myself and Larry Pesavento, for a full description.
It is not unusual to see multiple AB=CD patterns, and we never know if price will reach either, but we do want to monitor the market at these price levels due to the fact these patterns are forming. The upper blue horizontal trend line is marking the February 2020 highs for reference and relationship to these patterns.
As per Gartley’s statement quoted above, it would be prudent for traders to use other tools, such as a momentum indicator (like the MACD I show on Chart 3), and monitor for potential divergences. Other tools could be implemented as well, but the point is to use other tools.
Chart 2 shows the RSI, MACD and OBV. The RSI is approaching the February 2020 highs and could also be monitored with this setup. I will be monitoring these patterns in the coming days and weeks.
I will be presenting more Parallel Trend Line Channel charts on Tuesday June 3, 2020 at 1pm EST on StockCharts.com’s Your Daily Five show. I hope you can join me for that, and don’t forget to register for my presentation with the Virtual MoneyShow on June 12, 2020 (details below).
It’s always important to learn entry skills, which include combining elements of intraday time frames, momentum indicators and other price patterns to control risk and also, at times, waiting on the sideline until there is confirmation.
There are trading techniques that can be learned and implemented to control risk and monitor the price behavior. We never know what price will do; the only element we can control is the risk.
If you would like to learn more about these patterns and programs in order to learn how to trade them, please visit me at my website www.tradingliveonline.com, or feel free to email me at ljouflas@msn.com.
Best wishes for successful trading!
Leslie Jouflas, CMT
Please join me online for the MoneyShow Virtual Event June 10-12, 2020!
Contraction and Expansion Phases Using the AB=CD Pattern
Registration Link: https://online.moneyshow.com/june-2020/speakers/52f3d8b86e9343feb0224df7a0e9ade0/leslie-jouflas/?scode=050245