June has been fairly kind to the NASDAQ 100 index ($NDX), technology (XLK), software ($DJUSSW), and internet ($DJUSNS) and these have all been leaders, but the combination of overbought, negative divergences and a weak seasonal period has sent all four down to areas not seen recently. Let’s start with the NASDAQ 100:
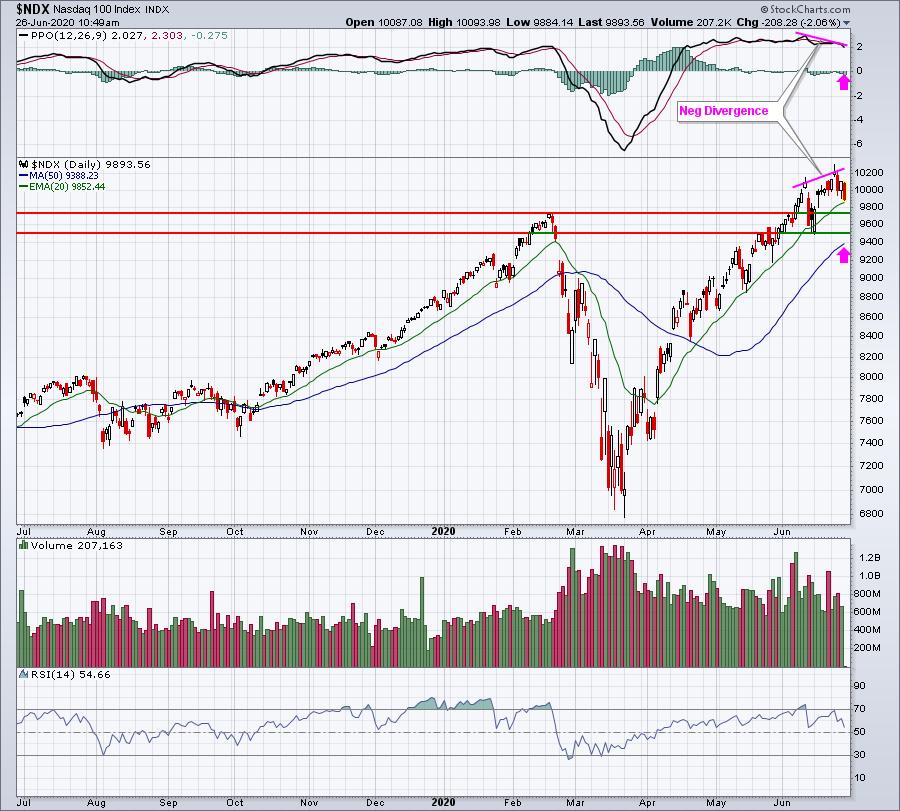
The negative divergence suggests at least the possibility of key PPO centerline and 50 day SMA tests (pink arrows). While we’ve seen tremendous resiliency in NASDAQ shares, a test of the 9500 area would help to relieve the momentum oscillators just as we approach earnings season, which probably wouldn’t be a bad thing at all.
The problem with the NASDAQ currently is that two leading industry groups that comprise a good portion of the NASDAQ have been signaling a flashing caution light for sometime now. Internet stocks ($DJUSNS) are breaking below their 20 day EMA with a negative divergence in play, so the 50 day SMA would seem to be a minimal target, barring a recovery later today to close above the 20 day EMA:
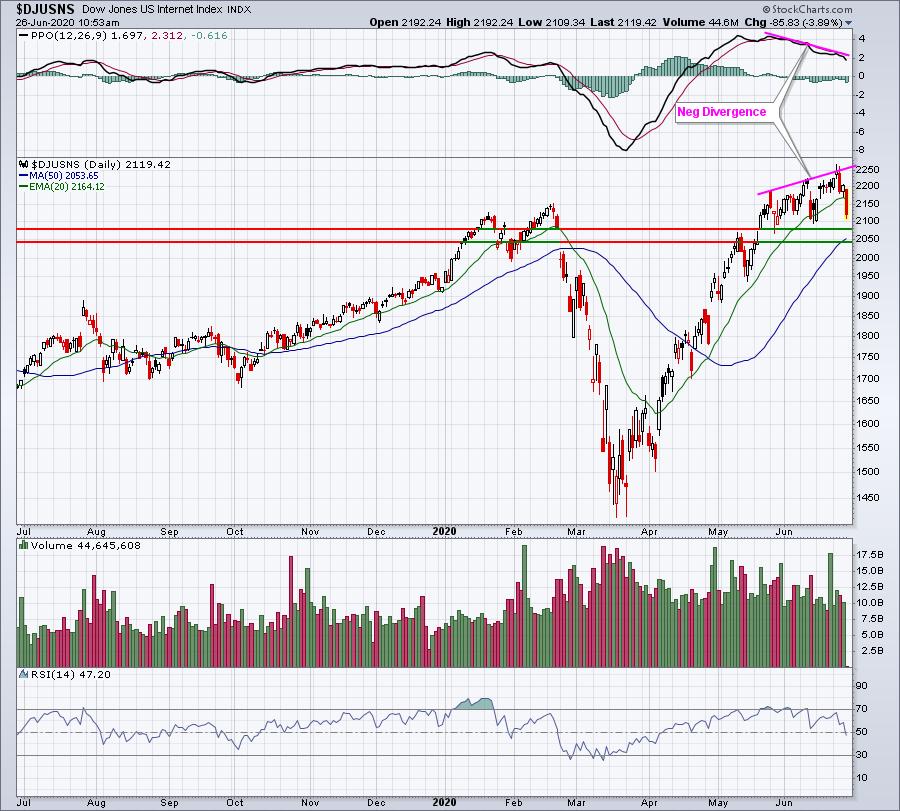
The two horizontal lines represent the top and bottom of gap support from mid-May. The 50 day SMA has now moved up into the middle of that gap support zone. Therefore, short-term I’d look for support in the 2050-2075 neighborhood. Software ($DJUSSW), one of the best industry groups of the last few years, also is adding to the selling pressure in equities:
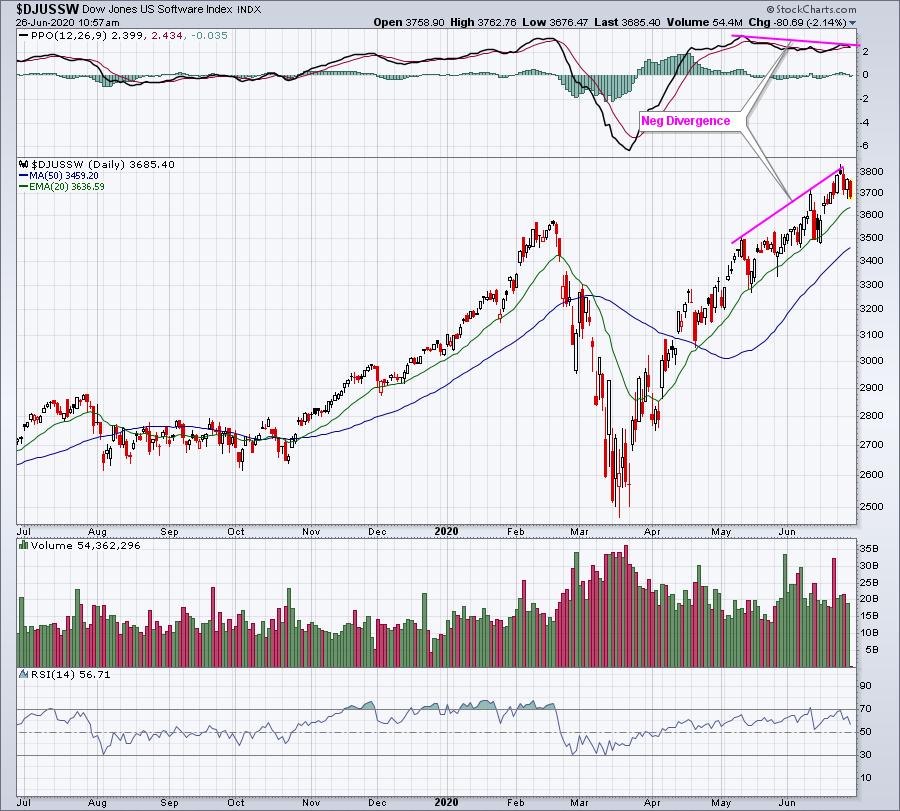
I’m a HUGE fan of software stocks. In the current market environment, this group can grow earnings rapidly and in a historically-low interest rate environment, the group deserves nose-bleed-type PEs. But it would not be unusual to see a big market scare just before earnings begin to come out in a few weeks. Could we see another 5% drop to test that rising 50 day SMA? Absolutely. Would I bank on it? No. I’ve said for the past three months that this selloff was much, much different than 2008. Yes, there are certain industries like airlines ($DJUSAR) and hotels ($DJUSLG) that are experiencing difficulties similar to what the banks went through during the financial crisis, but there has also been a TON of accumulation of areas that continue to perform well – even during the pandemic. I don’t know when the short-term selling will end. Maybe it’s later today. Maybe it’s next week. But I do firmly believe this selling will once again be met with accumulation, at least with respect to the stronger pandemic industries.
We now have 5 trading ChartLists where we’ve done the research for all of our members. We also have four portfolios that have been performing exceptionally well throughout this pandemic, including our flagship Model Portfolio. This portfolio is up 97.76% since we introduced it on November 19, 2018. That’s nearly a double in 19 months while we’ve suffered through two separate cyclical bear markets, including both the trade war and the COVID-19 pandemic. It’s confirmation that investing/trading the leading stocks in the leading industries is a formula for success in the stock market. All four of our portfolios are also included in ChartLists that we keep at StockCharts. If you’re a StockCharts.com Extra member or above AND you’re also an EarningsBeats.com member (including a trial member), you can download all NINE of these ChartLists directly into your StockCharts.com account. It’s truly a great feature that our members love. To get started, and to download those 9 ChartLists into your StockCharts account, you can start your fully-refundable $7 30-day trial RIGHT HERE.
Happy trading!
Tom