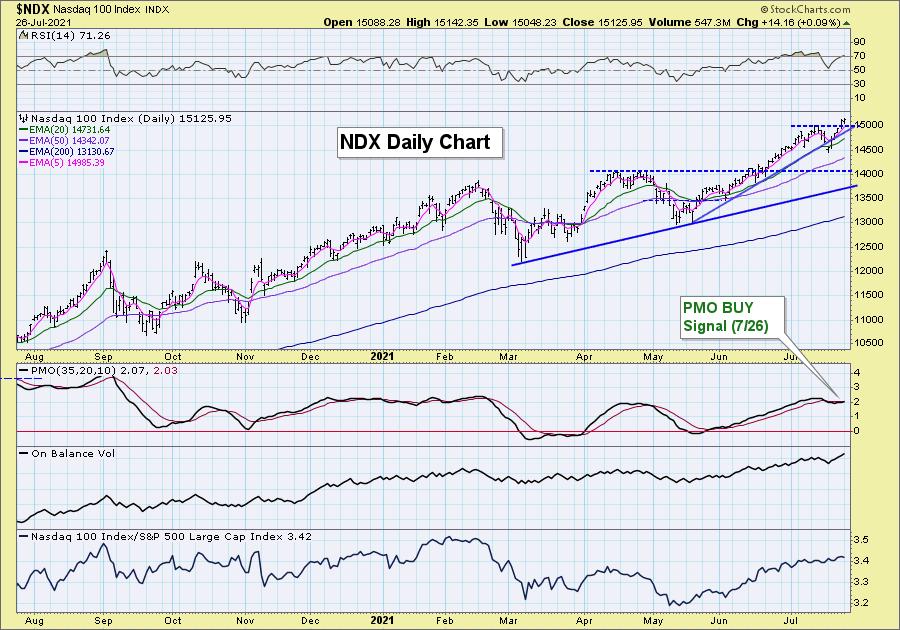
The market is continuing to see follow-through on the bounce that began last week. Charts and indicators that once looked very bearish are now turning around. Today both the SPX and NDX generated PMO crossover BUY signals. I’m going to focus in on the NDX, but I will follow-up with a look at the SPX as well.
As you can see, the PMO crossed over its signal line to generate today’s BUY signal. Price broke out to new all-time highs on Friday and it appears that it is headed higher given support is holding above the previous July top. The OBV is breaking higher to confirm the breakout. Relative performance shows that the tech-heavy NDX has been slowly, but surely, outperforming the SPX.
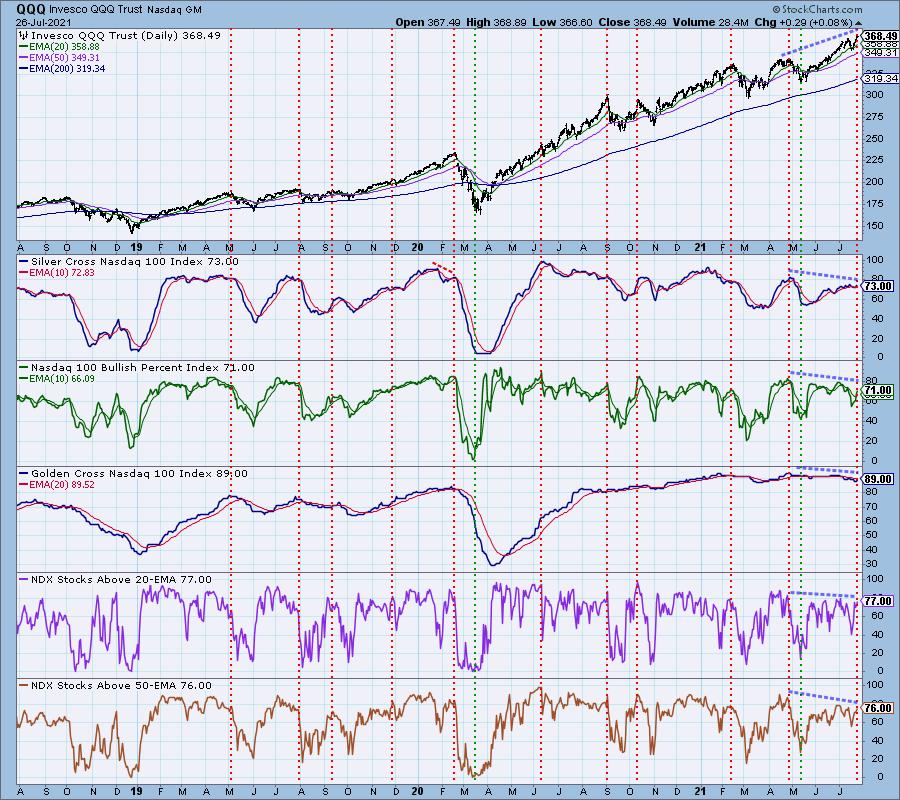
Let’s take a peek at the NDX Golden/Silver Cross Indexes. All of the indicators moved higher today, but all three carry negative divergences based on today’s new all-time high. These divergences suggest some problems under the surface.
However, the bias is currently somewhat bullish in the short and intermediate terms. We have a Silver Cross Index (SCI) reading of 73%. In the short term, there are 77% of stocks with price above their 20-EMA which is higher than the SCI. This means about 4% have 20-EMAs rising. Additionally, 76% have price above their 50-EMAs which is higher than the SCI. The margin between the SCI and %stocks indicators is still very thin, so while the bias is bullish, it isn’t exceedingly so.


Click here to register in advance for the recurring free DecisionPoint Trading Room! Recordings are available!
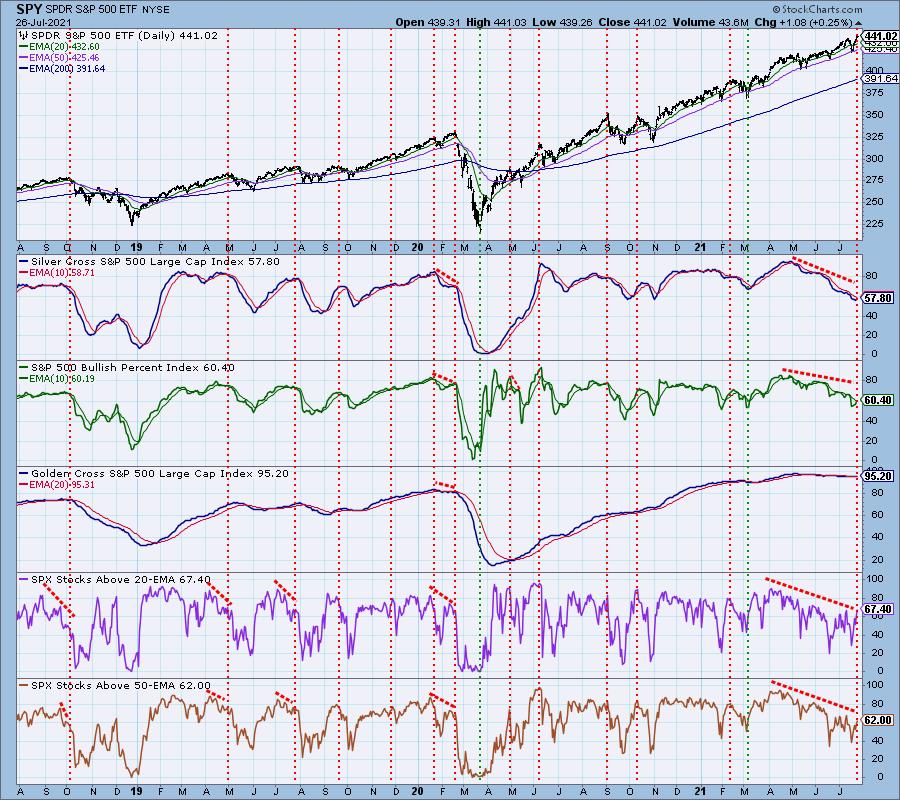
Let’s look at the Golden/Silver Cross Index chart for the SPX to get a sense of the bias. The SCI has turned up and the BPI has crossed over its signal line. Negative divergences persist on these indicators even as price makes new all-time highs. This is good news and bad news. The bad news is that, yes, there are negative divergences. However, the good news is that these readings are oversold and now rising.
The bias is bullish in both the short and intermediate terms given readings of 67.4% and 62% are higher than the SCI reading of 57.8%. This tells us that the SCI may move higher. It will take some time to erase these negative divergences so we should still proceed with caution.
Conclusion: Both the NDX and SPX garnered new PMO BUY signals and both are showing a slight bullish bias in the short and intermediate terms. We have to temper that enthusiasm by understanding both still have negative divergences on the new all-time highs set today.
If you like these Golden/Silver Cross Index charts, they are available with DAILY annotations on DecisionPoint.com for subscribers to either of our reports.
Technical Analysis is a windsock, not a crystal ball.
–Erin Swenlin
(c) Copyright 2021 DecisionPoint.com
Helpful DecisionPoint Links:
DecisionPoint Alert Chart List
DecisionPoint Golden Cross/Silver Cross Index Chart List
DecisionPoint Sector Chart List
Price Momentum Oscillator (PMO)
Swenlin Trading Oscillators (STO-B and STO-V)
DecisionPoint is not a registered investment advisor. Investment and trading decisions are solely your responsibility. DecisionPoint newsletters, blogs or website materials should NOT be interpreted as a recommendation or solicitation to buy or sell any security or to take any specific action.