Note 2: There have been reports showing an increase in cash out refinances, but it isn’t showing up significantly in the Fed’s Flow of Funds report.
The following data is calculated from the Fed’s Flow of Funds data (released today) and the BEA supplement data on single family structure investment. This is an aggregate number, and is a combination of homeowners extracting equity – hence the name “MEW” – and normal principal payments and debt cancellation (modifications, short sales, and foreclosures).
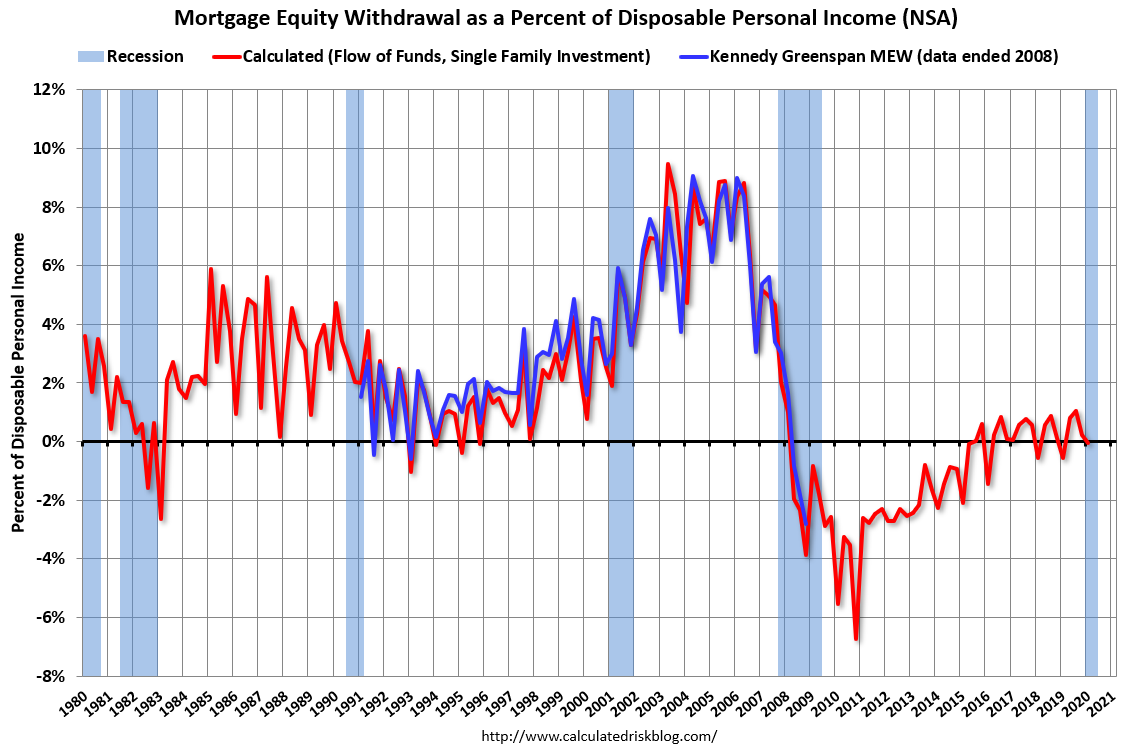
For Q1 2020, the Net Equity Extraction was –$1 billion, or a -0.03% of Disposable Personal Income (DPI) .
 Click on graph for larger image.
This graph shows the net equity extraction, or mortgage equity withdrawal (MEW), results, using the Flow of Funds (and BEA data) compared to the Kennedy-Greenspan method.
Note: This data is impacted by debt cancellation and foreclosures, but much less than a few years ago.
MEW has been mostly positive for the last four years.
The Fed’s Flow of Funds report showed that the amount of mortgage debt outstanding increased by $59 billion in Q1.
For reference:
Dr. James Kennedy also has a simple method for calculating equity extraction: “A Simple Method for Estimating Gross Equity Extracted from Housing Wealth“. Here is a companion spread sheet (the above uses my simple method).
For those interested in the last Kennedy data included in the graph, the spreadsheet from the Fed is available here.