Signs of risk aversion are increasing in the financial markets. Risk aversion first appeared in the junk bond market in October and this week we are seeing money move into Treasury bonds, the ultimate safe-haven assets.
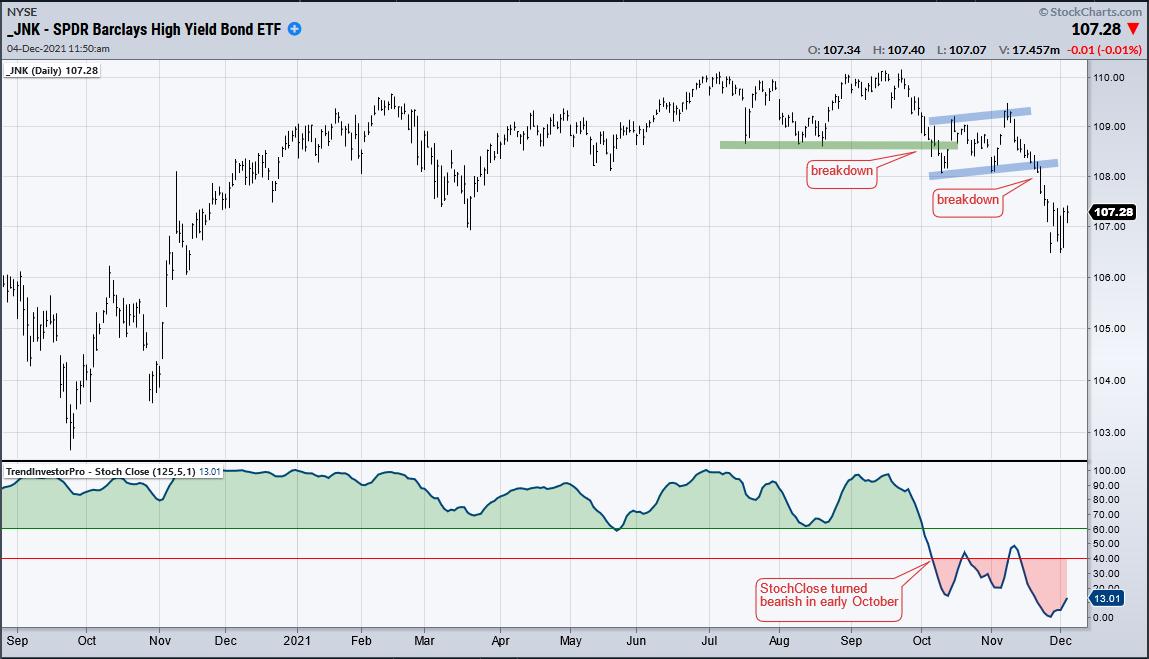
Junk bonds have the highest risk because they are the lowest-rated corporate bonds. As such, weakness in junk bonds points to risk aversion in the corporate bond market. The first chart shows the Junk Bond ETF (JNK) hitting resistance in the 110 area in July and September, and then breaking down in October. The ETF consolidated near the support break and then continued sharply lower in November. The indicator window shows StochClose (125,5), a trend following indicator, turning bearish in early October.
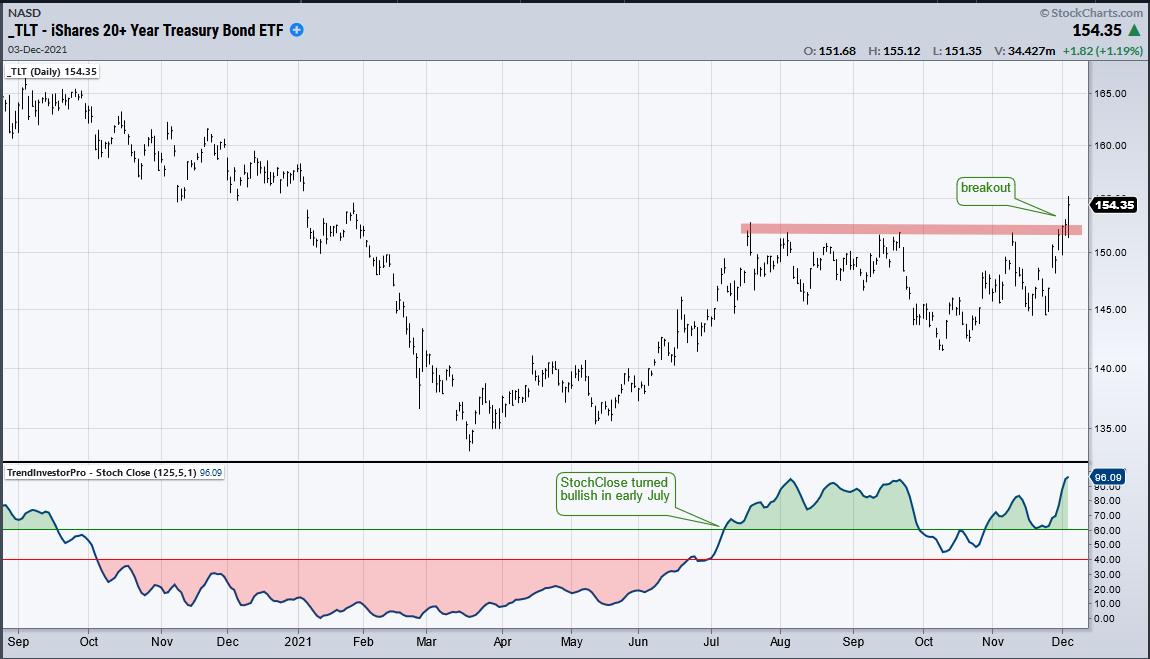
Treasury bonds are the exact opposite of junk bonds because they are deemed the safest bonds in the US bond market. In contrast to junk bonds, Treasury bonds can benefit when economic prospects dim and/or risk aversion creeps into the financial markets. The next chart shows the 20+ Yr Treasury Bond ETF (TLT) advancing from March to July, consolidating and breaking out this week. Also notice that StochClose turned bullish in early July. Note that StochClose is part of the TIP Indicator Edge Plugin for StockCharts ACP.
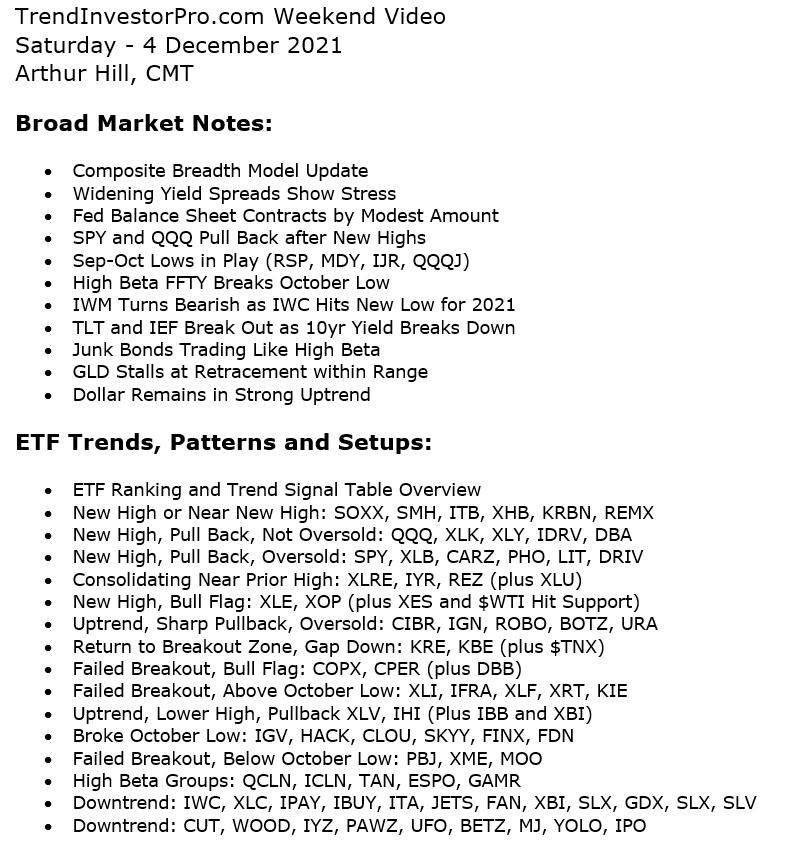
We are also seeing signs of risk aversion within the stock market as high-beta stocks and ETFs get hit hard. Mid-caps and small-caps are also weighing on breadth. Risk aversion, breadth signals and dozens of ETFs were covered this week at TrendInvestorPro. The image below shows the topics for the weekend video. You will need a chair and a warm drink for this one. Click here to subscribe and get immediate access.
Click here to take your analysis to the next level.
————————————————