The Utilities SPDR is lagging the broader market over the last eight weeks, but a close look at price action reveals an uptrend, a bullish continuation pattern and an uptick in short-term momentum. Let’s investigate.
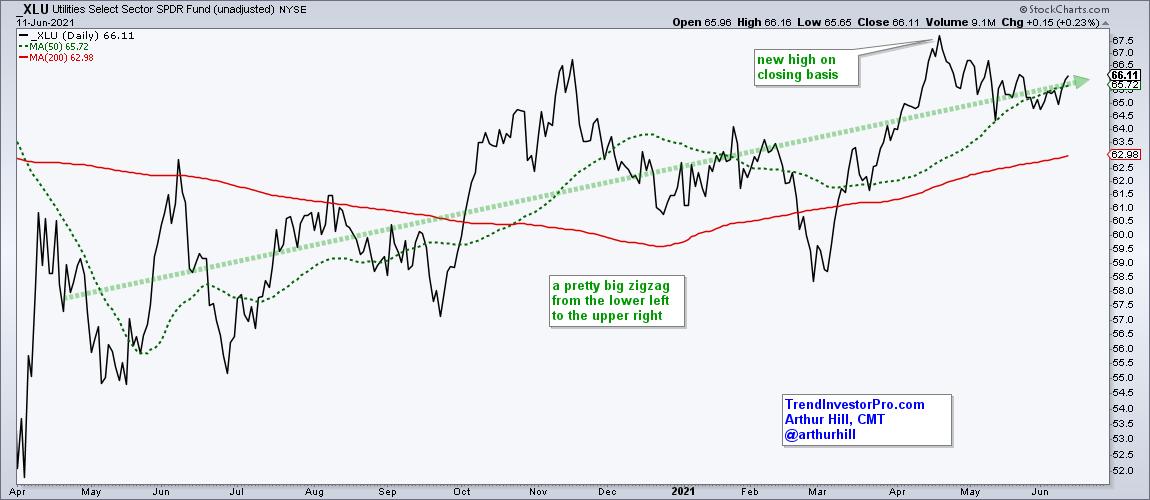
First and foremost, the long-term trend is up for the Utilities SPDR (XLU). The ETF hit a new high in April and is trading well above its rising 200-day SMA. The 50-day SMA is also above the 200-day. A long-term uptrend means we want to look for bullish setups and bullish continuation patters. In other words, trade in the direction of the bigger trend.
A bullish continuation pattern is basically a correction within a bigger uptrend. Corrections can take the shape of flat trading ranges (rectangles), declines (falling wedges/channels), contracting consolidations (triangles) or some sort of hybrid. Corrections digest the prior gains and pave the way for the next move.
The chart shows XLU with a 16.7% advance and a triangle of sorts taking shape. XLU was quite overbought after this big advance and the triangle consolidation alleviated these overbought conditions. A triangle breakout would signal an end to the correction and a resumption of the bigger uptrend.
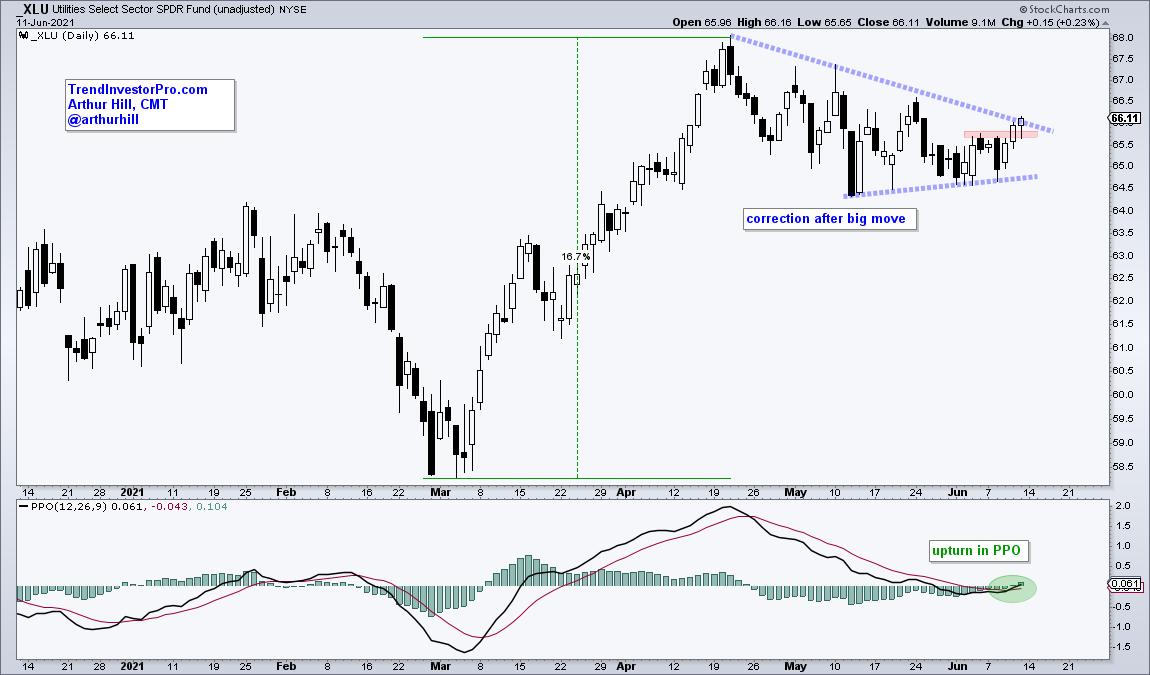
Signs of a breakout are already present. First, XLU broke above last week’s high with a two day surge last week (Wed-Thu). Second, the Percentage Price Oscillator (PPO) turned up with a move above its signal line and into positive territory. This shows an upturn in momentum. I would expect XLU to complete its triangle breakout as long as the PPO holds above its signal line.
Looking for more bullish setups in ETFs? TrendInvestorPro.com tracks trend signals, ranks performance and highlights bullish setups from our ETF universe. Click here to take your charting to the next level!
————————————————–