Global demand for natural gas continues to skyrocket in the wake of Russia’s invasion of Ukraine.
Over the last year, demand for LNG has risen incredibly, as have LNG stockpiles. The United States is competing with Australia and Qatar for the world’s largest exporter of natural gas to supply Europe. With Russian natural gas supplies essentially off the table in Europe, natural gas prices are projected to rise much further. (Russia furnished half of the European Union’s gas imports in 2021.)
The conflict and sanctions have caused a price differential and supply disruption between the US and European LNG. Europe’s energy markets are greatly disadvantaged. On the demand side, European power costs soared late last year, even before Russia invaded Ukraine. That is also one of the underlying structural reasons suggesting that a recession will most likely not permanently cure rising natural gas prices in Europe.
Then, with all the strong fundamentals, why has natural gas futures fallen so hard so fast?
Natural gas futures are extraordinarily volatile and recently fell 18% in a month. Supply remains extremely tight. Furthermore, just today, Bloomberg put out a story that the cost of sand has spike 150% in Texas.
The COVID rebound, like so many other parts of the economy, continues to create mismatches, supply chain constraints, and dislocations. Frackers are having issues with sand supply and have seen disruptions, labor shortages and trucking bottlenecks. Still, companies, governments, and investors continue to consume, produce, and supply energy and, at the same time society is developing renewable energy plans, including renewable natural gas and hydrogen, to reduce emissions and meet global net-zero targets.
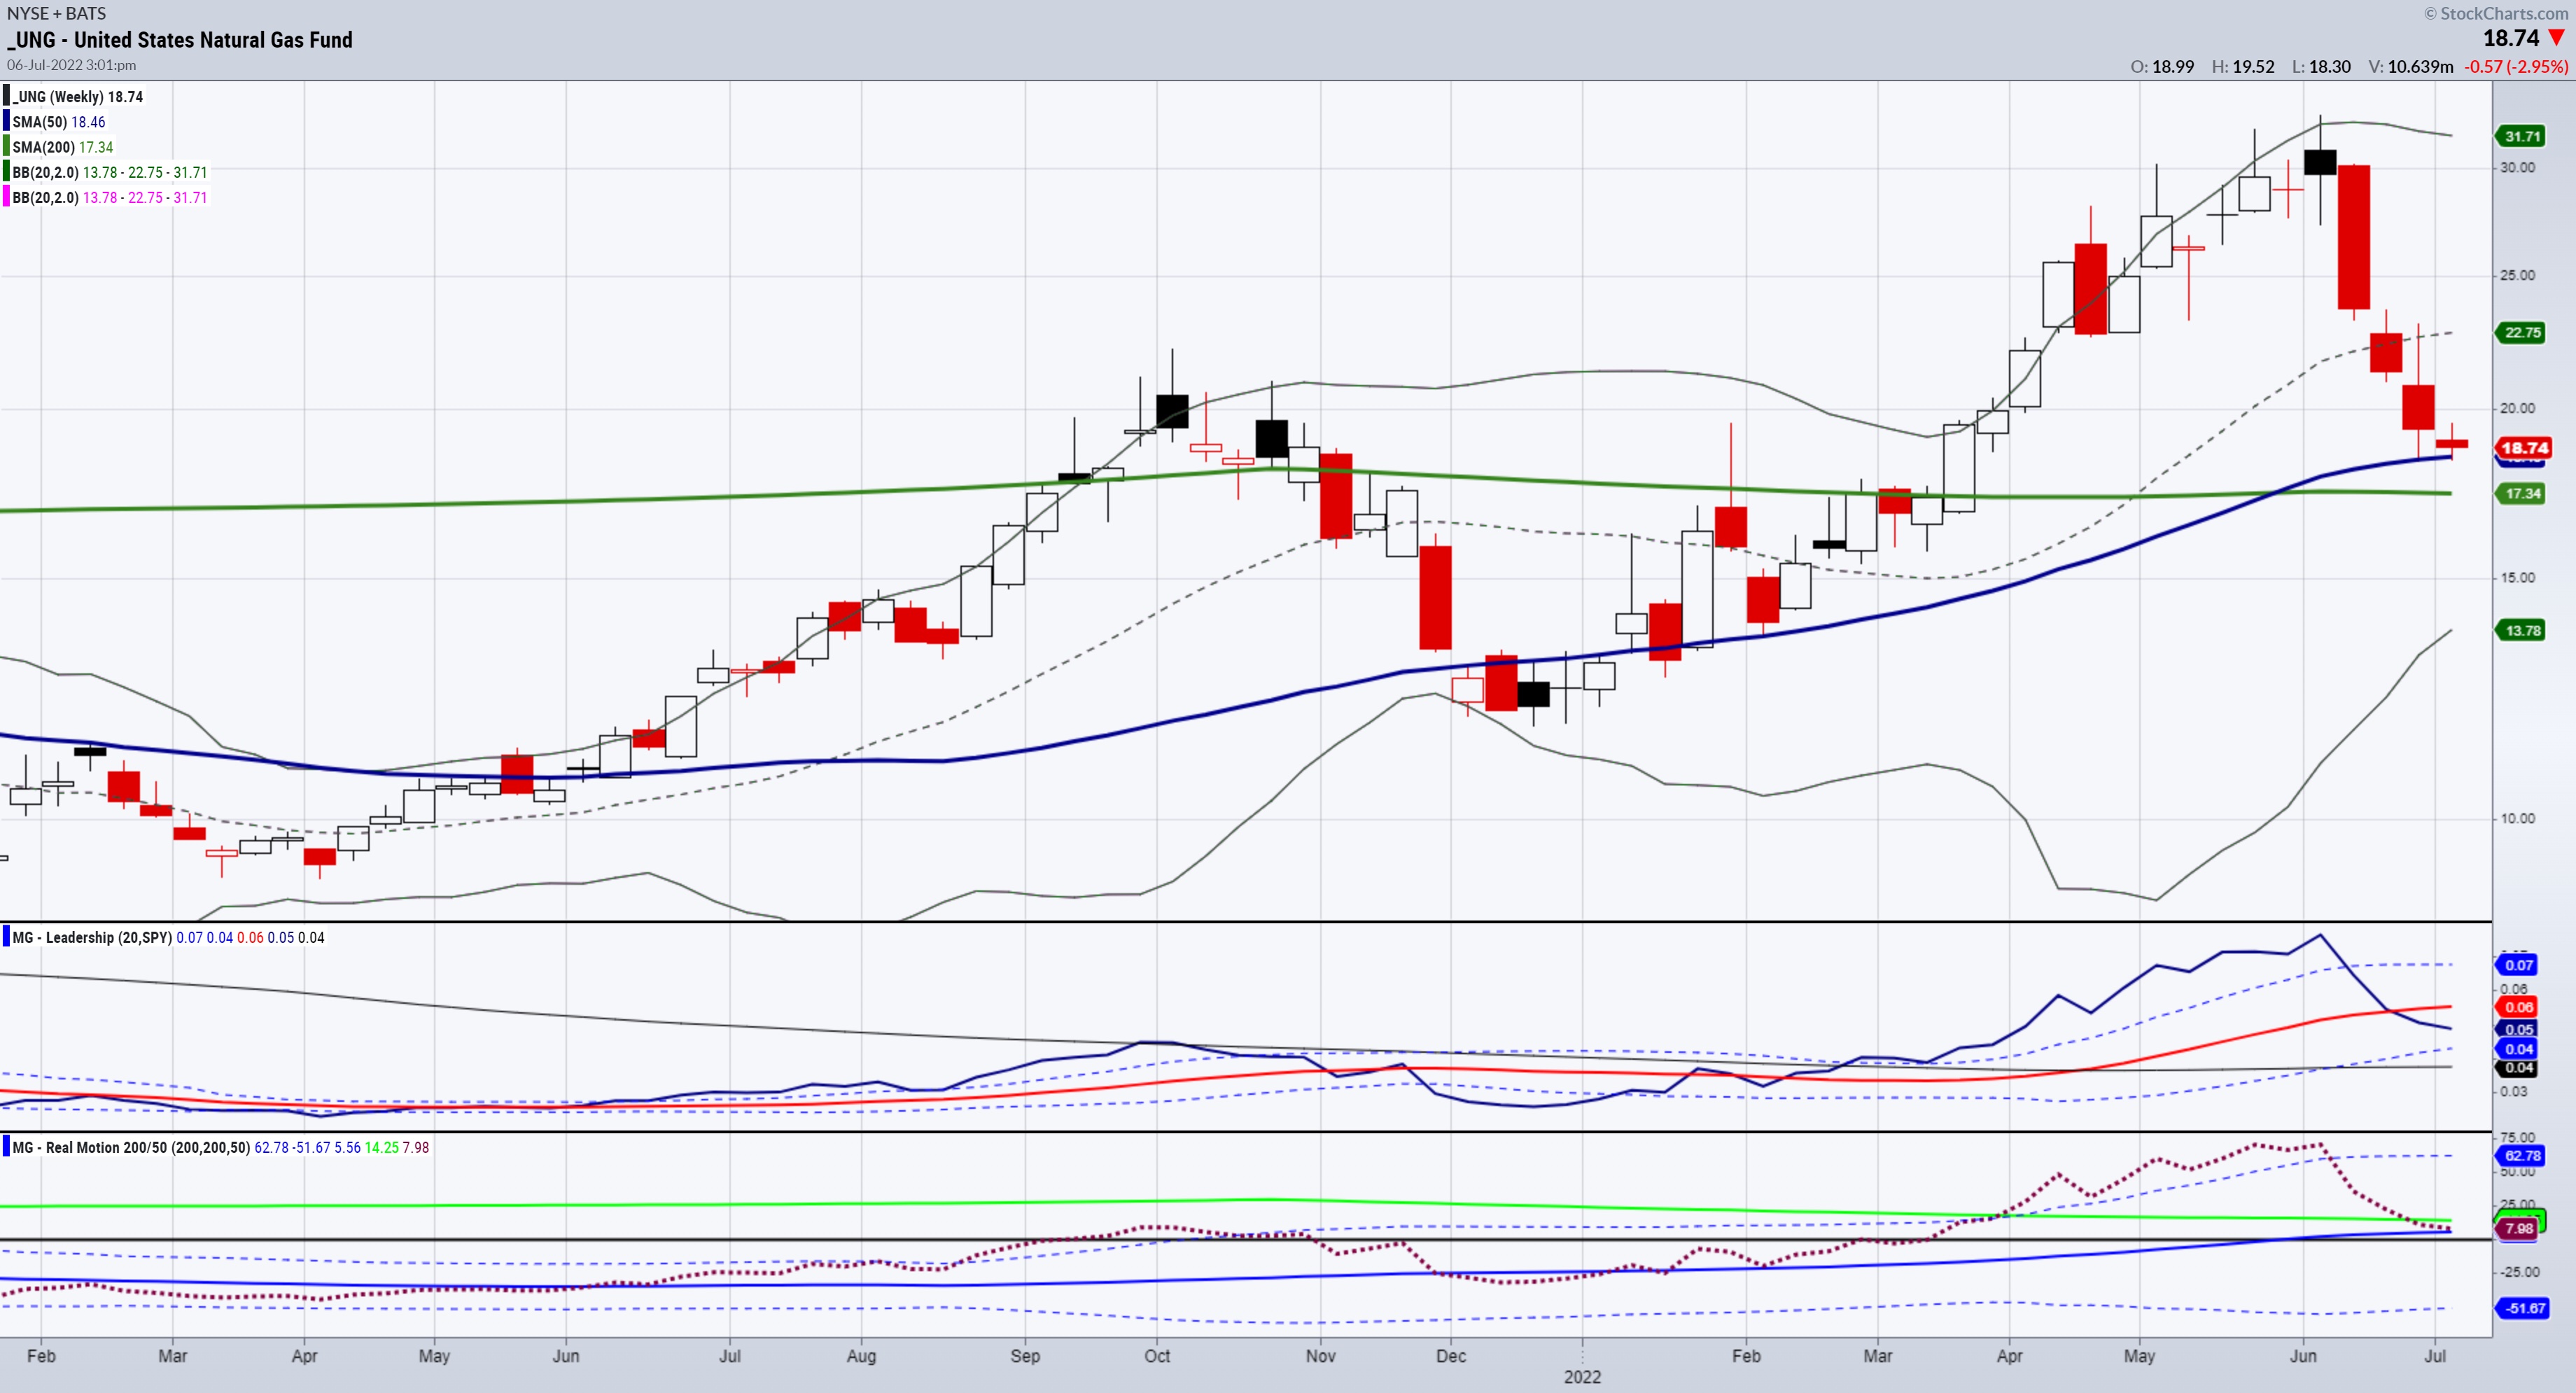
Where Technicals and Fundamentals Meet
The weekly chart shows the major support at both the 50 and 200-week moving averages. Should UNG clear the 200-DMA very soon, then one could enter long in anticipation that the price versus fundamentals became dislocated, and trade it with a very tight risk under recent lows.
 Get your copy of Plant Your Money Tree: A Guide to Growing Your Wealth and a special bonus here.
Follow Mish on Twitter @marketminute for stock picks and more. Follow Mish on Instagram (mishschneider) for daily morning videos. To see updated media clips, click here.
Mish in the Media
See Mish as she joins MarketGauge’s Keith Schneider, DecisionPoint’s Erin Swenlin and StockCharts’ David Keller to discuss how they coped with past prolonged bearish periods in the new StockCharts TV special presentation “Survival of the Fittest: A Brief History of Bear Markets”.
Mish talks about China, ARKK, Staples and Commodities – regardless where the economy goes – in this appearance on Fox Business’s Making Money with Charles Payne.
Read Mish’s latest article for CMC Markets, “When Dr. Copper Speaks, We Listen“.
With newer fears of recession, Mish takes a walk back to the 1970s, when dislocation wreaked havoc by the end of the decade, in this video from Bloomberg TV.
ETF Summary
- S&P 500 (SPY): 378-380 support zone.
- Russell 2000 (IWM): Support is 170; needs to clear 174 to stay in the game.
- Dow (DIA): 307 support and needs to clear 315.
- Nasdaq (QQQ): 282.50-283 pivotal and 290 resistance.
- KRE (Regional Banks): 56 the 200 WMA 60 resistance.
- SMH (Semiconductors): 200 resistance.
- IYT (Transportation): 211.90 support with resistance at 220.
- IBB (Biotechnology): Needs to hold 120.
- XRT (Retail): 59.24 pivotal support.
Mish Schneider
MarketGauge.com
Director of Trading Research and Education