This isn’t the first time I’ve written about my favorite penny stock chart pattern for small accounts. But in this bubble market, it’s happening so often that NOW is the time to learn it. Spend time with these charts. Burn the pattern into your brain.
Like all chart patterns, there are variations. I’ll show one common variation. Also, this post doesn’t explain how to trade the pattern. It’s about recognition. So be sure to watch the included video. And read this post about my strategy for the pattern.
But first…
Karmagawa’s 74th School Nearly Complete
I’m proud to announce Karmagawa’s 74th school/library project will open soon. It’s our 24th partnering with Bali Children’s Project. It’s just another step on the way to 1,000 schools worldwide.
This is what it looks like now…
2 big milestones 1.) I made $17,000+ today on my trades, now I’m +$506,016 in trading profits in 2021 which is just INSANE, see https://t.co/occ8wKmlgm to learn 2.) my charity’s 74th school is nearly complete, check out the beautiful pictures of the classroom that will soon open! pic.twitter.com/d8hVNVq9iU
— Timothy Sykes (@timothysykes) February 18, 2021
So much has happened since our first school in Bali opened less than five years ago. Most importantly, thousands of children have had the opportunity for a better education.
Every new school we open will help educate hundreds, if not thousands, of students in the coming years.
Sadly, haters on social media put me down for donating 100% of my trading profits. But that won’t stop me…
You wanna hate me for dip buying pumps, donating the trading profits to charity/teaching my students THE PROCESS then go ahead IDGAF! I’ll just keep trading/teaching/building more & more schools, anyone who hates on education is irrelevant as everyone sees how life-changing it is
— Timothy Sykes (@timothysykes) February 18, 2021
New $120,000 Donation to Help Families in Texas
I’m proud to announce donations to Central Texas Food Bank, World Central Kitchen, MercyChefs, and North Texas Food Bank. These great charities are helping families suffering the after-effects of the big freeze.
I’m proud to announce $120,000 in donations to @CTXFoodBank @WCKitchen & @ntfb to #HelpTexas during this crisis, please retweet/fav & help me raise more $ as we also started a @karmagawa fundraiser, see https://t.co/tF8B7LMUJe as ALL donations great and small are appreciated! pic.twitter.com/EZd1xeZkpG
— Timothy Sykes (@timothysykes) February 21, 2021
We’ve also started a fundraiser. Remember, you don’t have to give big checks to make a difference. Many charities are struggling to raise money right now. Even small amounts help.
Donate to Karmagawa’s Fundraiser to Help Feed People in Texas
Congratulations and Giving Back With Kyle
Once again, congratulations to Kyle Williams for reaching the seven-figure milestone.*
(*Please note that these kinds of trading results are not typical. Most traders lose money. It takes years of dedication, hard work, and discipline to learn how to trade. Individual results will vary. Trading is inherently risky. Before making any trades, remember to do your due diligence and never risk more than you can afford to lose. I’ve also hired Kyle to help in my education business.)
In honor of Kyle’s achievement, we surprised him with a few veggies. Check it out…
View this post on Instagram
I’m also happy to announce a $50,000 donation to the San Diego Food Bank in Kyle’s honor. The food bank feeds 350,000 people each month. We’re proud to support their great work.
Now it’s time to learn about my favorite penny stock chart pattern for small accounts. This pattern is a HUGE part of my trading success*…
Trading Mentor: My Single Favorite Penny Stock Chart Pattern for Small Accounts
Trading is about more than just stock chart patterns. But when I ask my top students if there was one thing they figured out that helped most, I get one of two answers. Most of the time I get both.
First, they learned to cut losses quickly. It became mechanical. That doesn’t mean they don’t take big or unnecessary losses. Most top traders lose their self-discipline occasionally. But my top students turned cutting losses quickly into a habit.

Second, they almost all focused on one favorite stock chart pattern. They tested and tweaked to find what works for them, then focused on it. Later, they expanded their skills to other setups.
Which is why this edition focuses on one pattern. Most of my students start with small accounts. I LOVE this stock chart pattern for small accounts.
My Favorite Penny Stock Pattern for Small Accounts: Intraday Panics
First, watch this video. Even though I made it four years ago, the pattern is STILL playing out. In this bubble market, it’s playing out often…
Now that you’ve seen panics from four years ago, let’s look at some recent dip buy opportunities. I’ll start with two near-perfect examples of my favorite stock chart pattern. Then I’ll show you several from the past two weeks.
Memorize This Stock Chart Pattern
(Hint: I’ll do a trade review after the chart examples.) Don’t just breeze through this, study the charts. Notice the big panics. Pay attention to the trading volume during the panic and bounce. Burn these charts into your brain. This is what I do every morning.
These two charts from 2020 are beautiful examples of classic intraday panics. The first chart is DECN from April 23, 2020. The second is CYDY from June 30, 2020…
Decision Diagnostics Corp. (CVEM: DECN) April 23, 2020
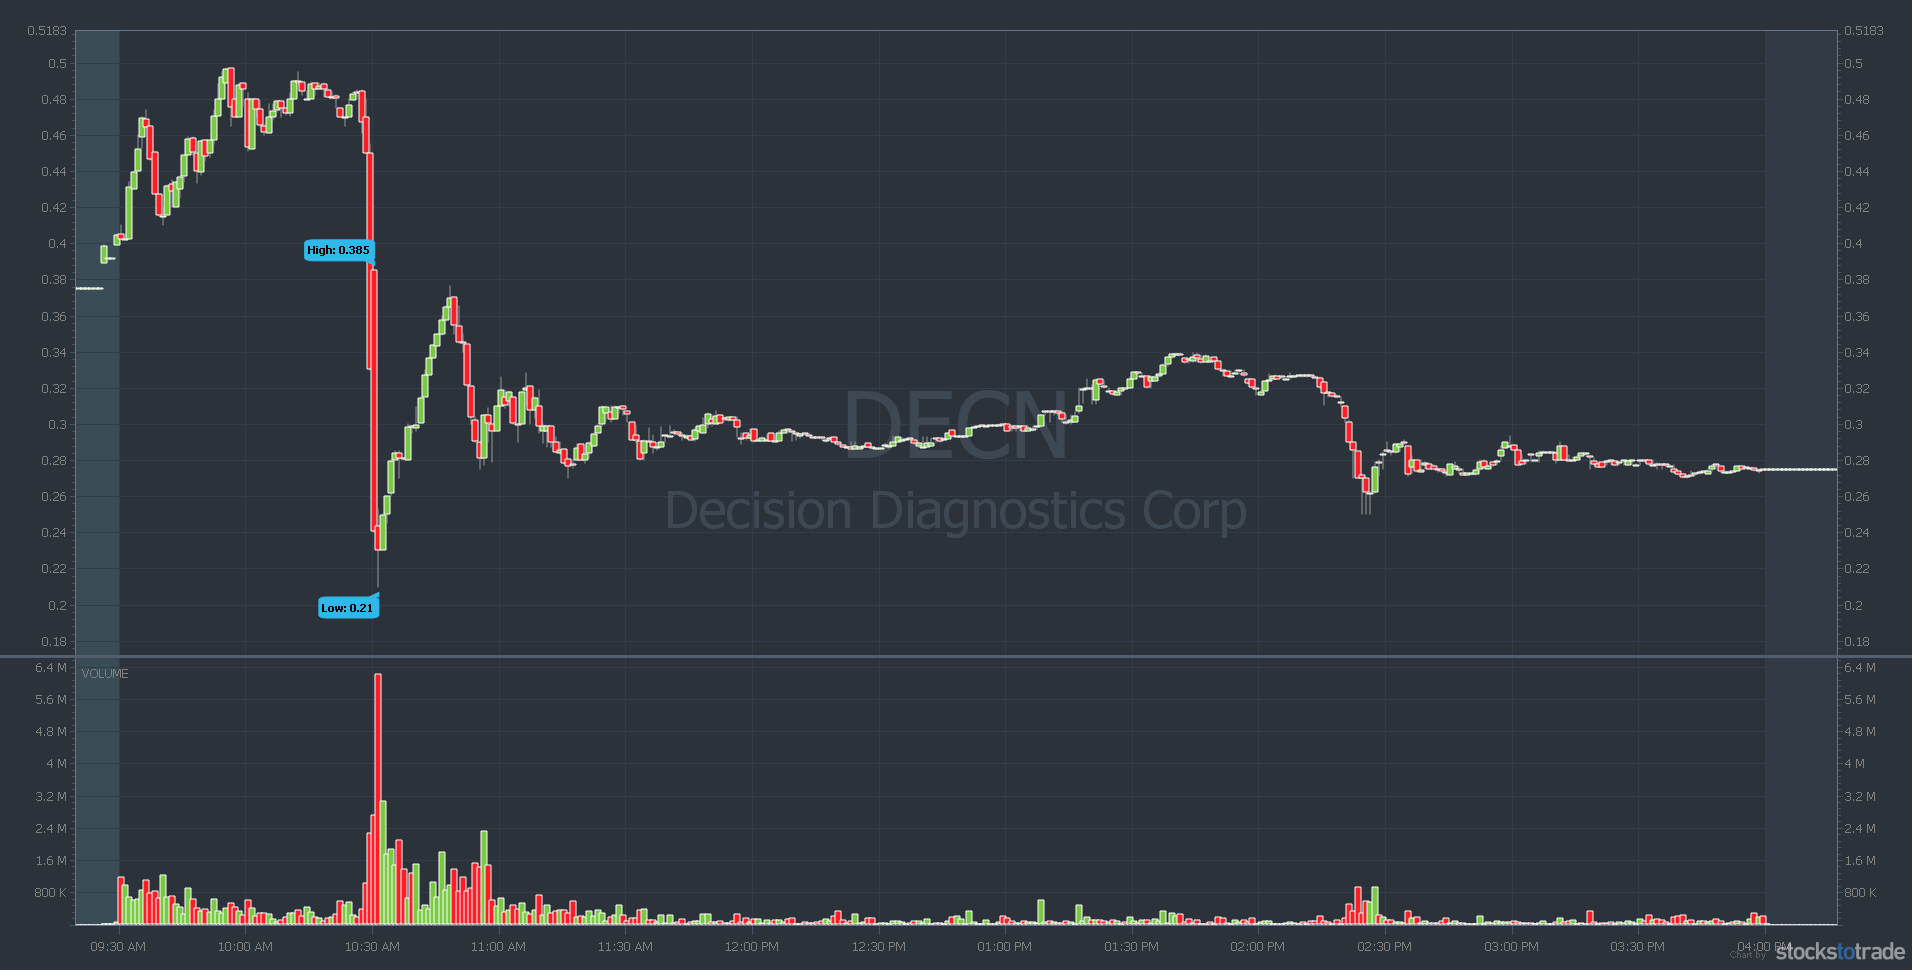
I called this panic the day before…
WOW, what a perfect $DECN panic & bounce, CLASSIC https://t.co/4lKUY5SH24 panic pattern I not only made 19% or $3k+ on, but called it AHEAD OF TIME in my https://t.co/EcfUM63rtt webinar last night, that’s why hundreds of my students banked…were you prepared? LEARN THIS PATTERN! pic.twitter.com/vGIqFfuYzQ
— Timothy Sykes (@timothysykes) April 23, 2020
How? Experience and studying the past.
Studying the past, learning from the present, becoming self-sufficient & acquiring A TON of knowledge/expertise is what’s needed for the most success over time, NOT relying on ANYONE else’s picks. All that does is make you dependent & usually brainwashed if you trade penny stocks
— Timothy Sykes (@timothysykes) February 18, 2021
I’ve seen this stock chart pattern hundreds, if not thousands, of times. (If you haven’t watched the video lesson in this post, watch it now. This pattern keeps happening.)
Now check out the CYDY chart…
CytoDyn Inc. (OTCQB: CYDY) June 30, 2020
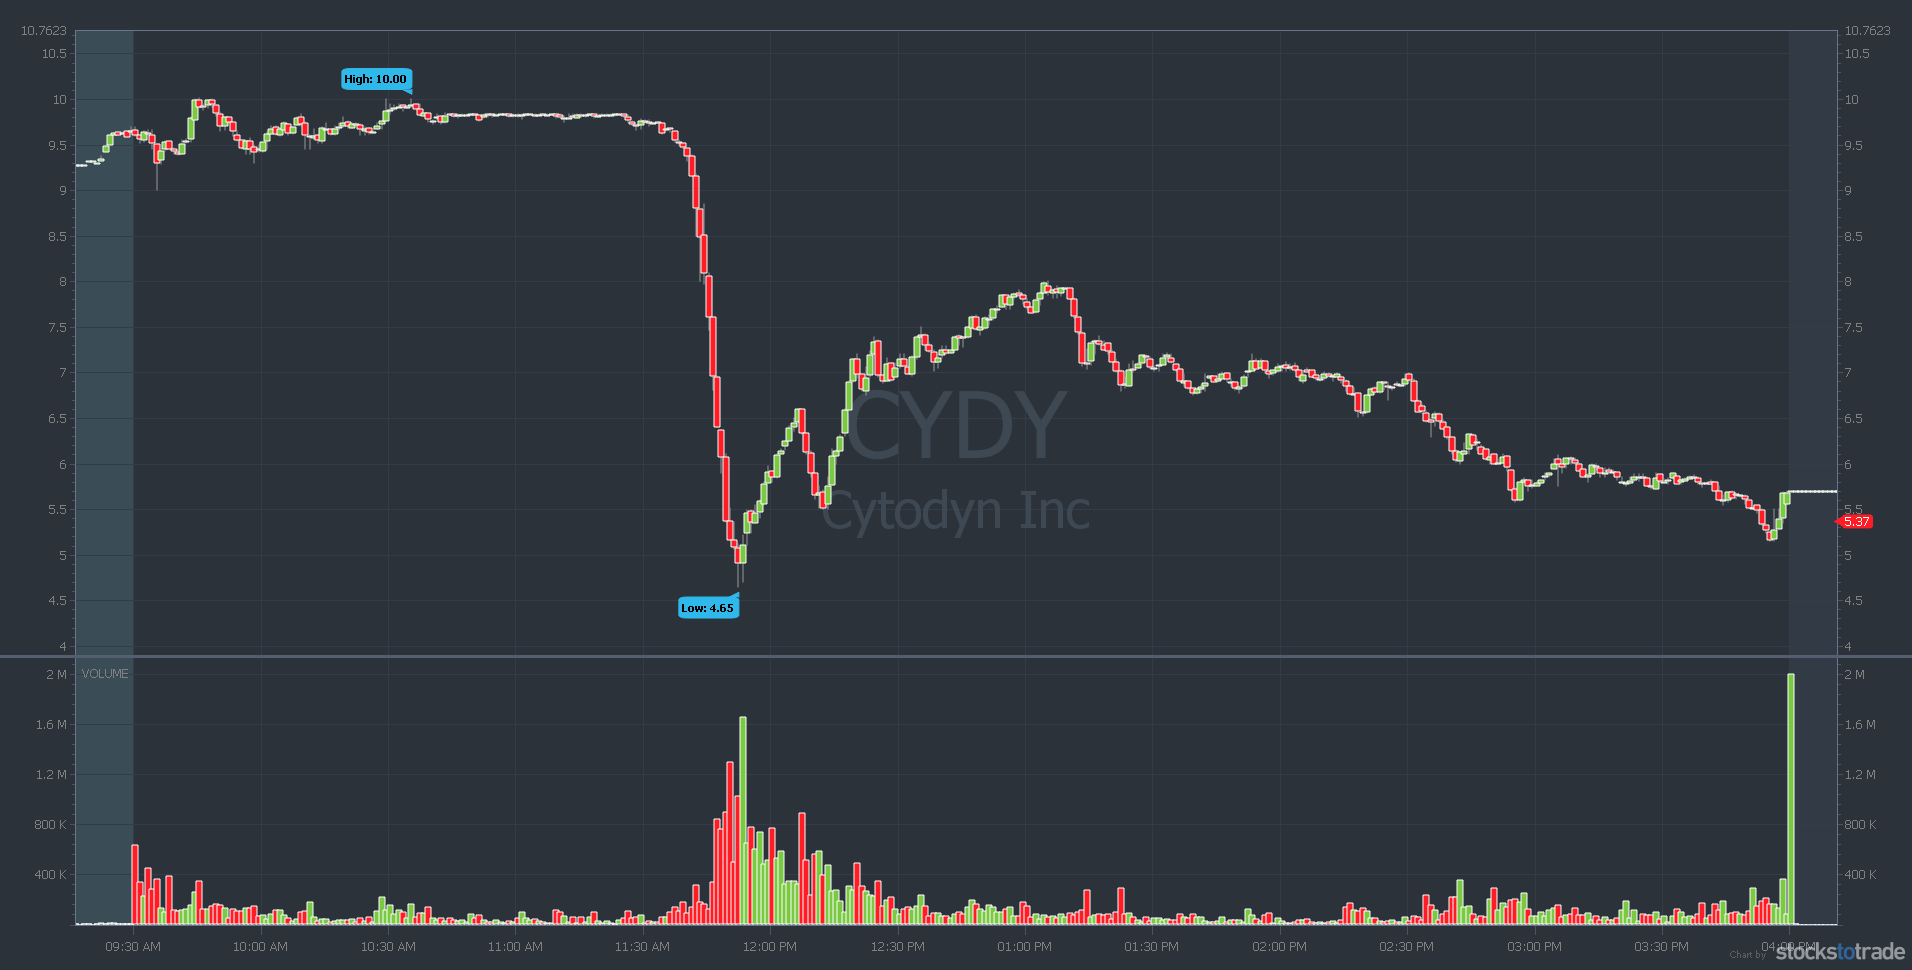
CYDY was a classic OTC morning panic and one of the prettiest of the past several years. Some students were short selling this. Others bought the dip. For me, he started tracking everything. He figured out what was working for him. As it turns out, it was only two patterns. He’d tried short selling is a risky strategy in this market. So I focused on the dip buy. See details of my CYDY trade here.*
(*Please note: My results are far from typical. Individual results will vary. Most traders lose money. I have the benefit of years of hard work, dedication, and experience. Trading is inherently risky. Do your due diligence and never risk more than you can afford to lose.)
Do you see the similarities in the charts? DECN and CYDY were two of the cleanest panics of 2020. The pattern isn’t always that clean. And it doesn’t always bounce. (Trading isn’t an exact science.)
Here are even more recent examples of my favorite small account stock chart pattern…
Solar Integrated Roofing Corporation (OTCPK: SIRC) February 8, 2021
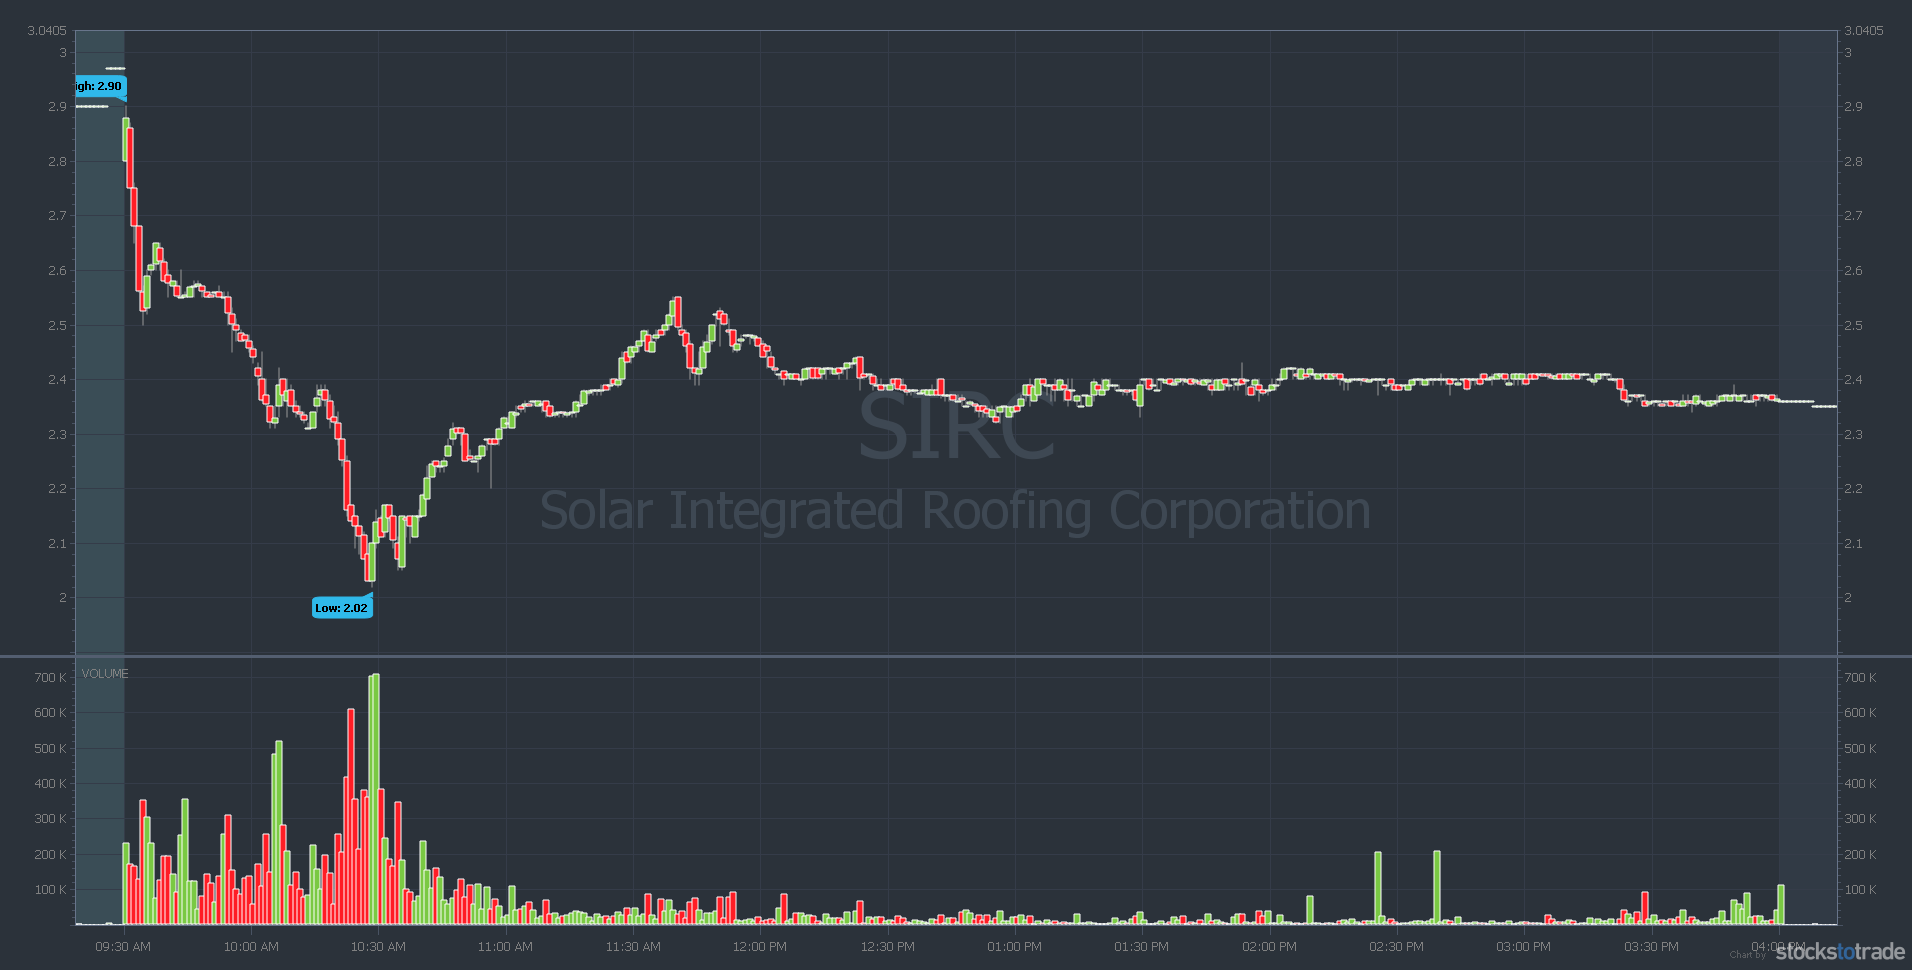
SIRC panicked at the open and bounced more than once. The best bounce was after the double bottom. I’m not very good with double bottoms. It’s tough to be sure if it’s the real turn or about to fall off a cliff.
Now check out TSNP from the next day…
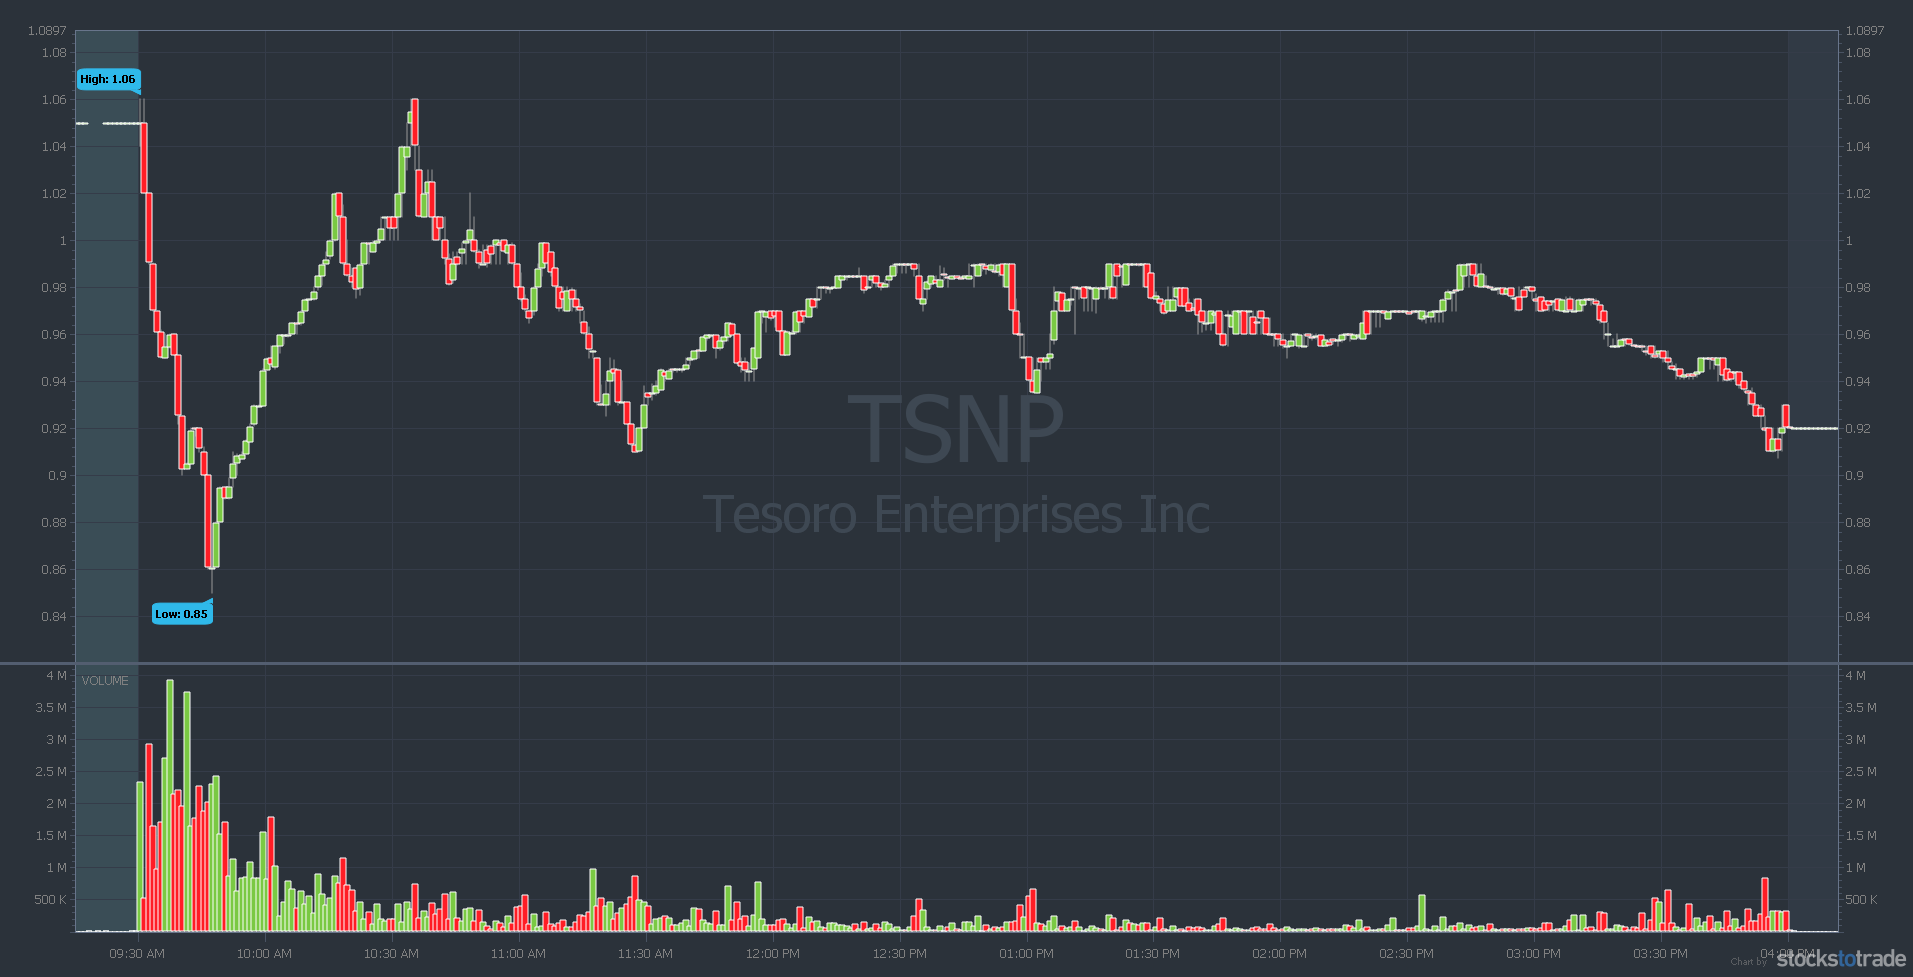
Tesoro Enterprises, Inc. (OTCPK: TSNP) February 9, 2021
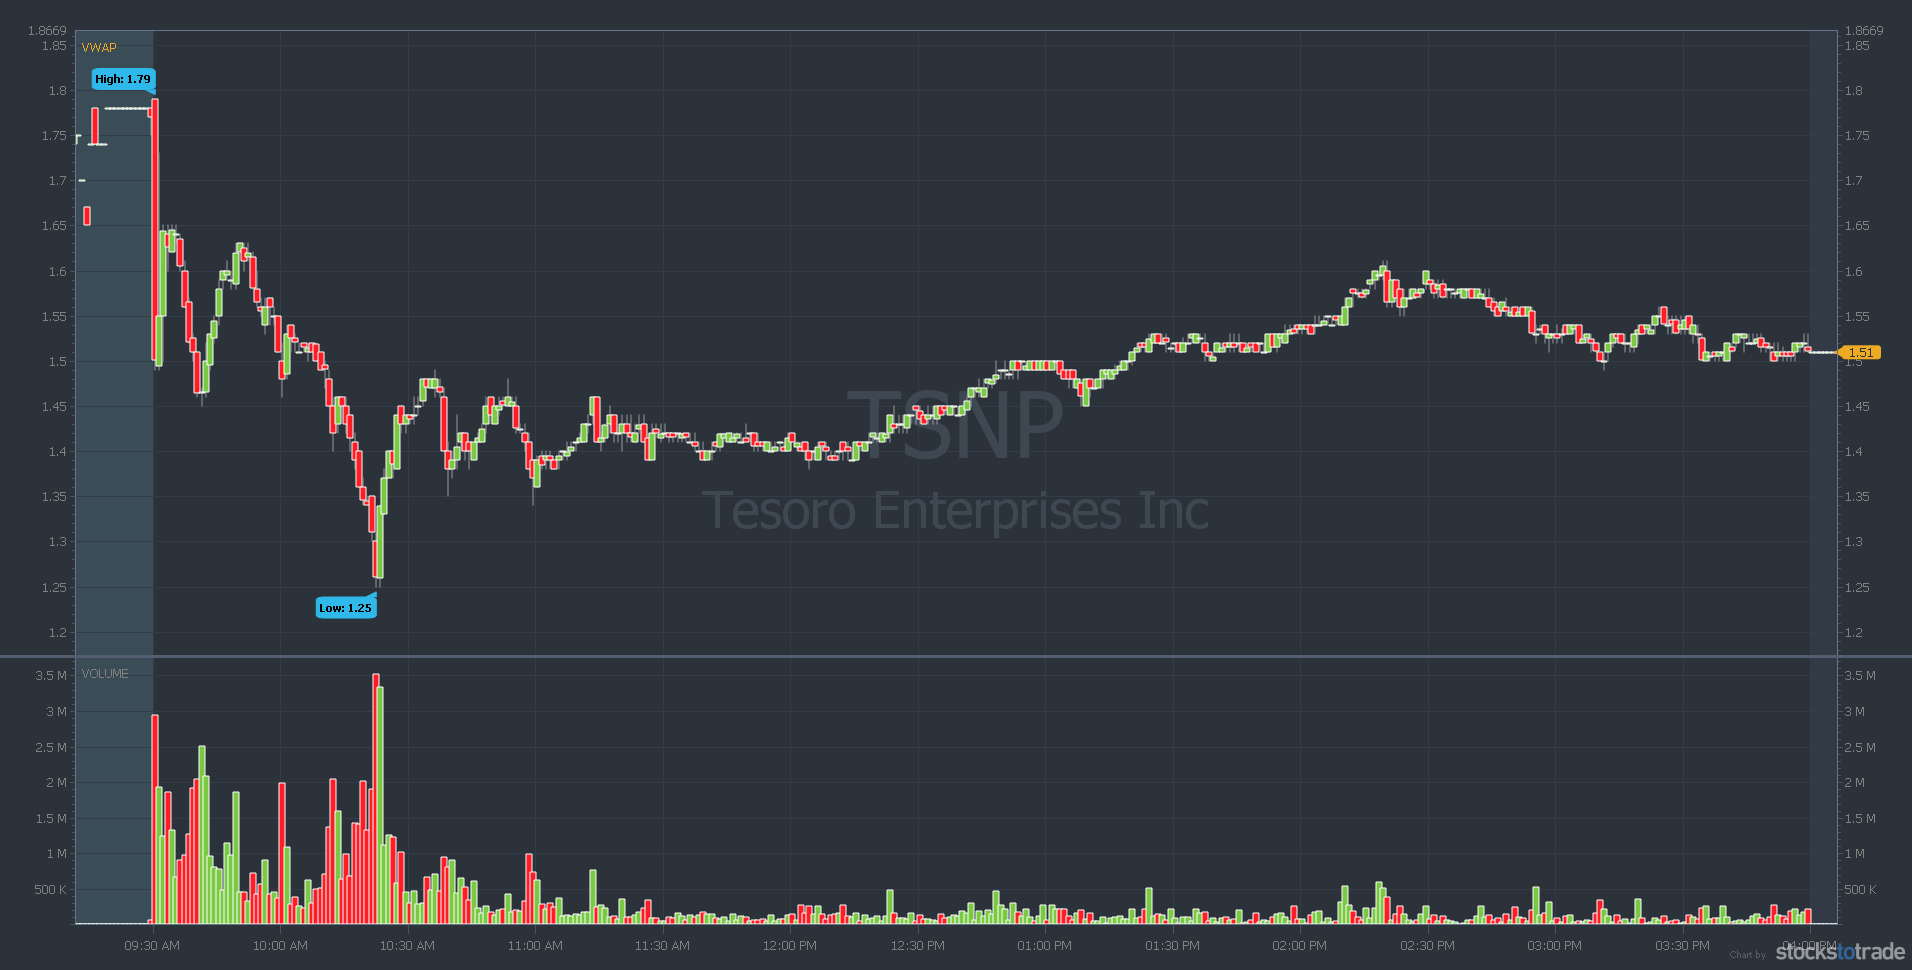
TSNP is my single biggest winning play of the past few years. The bounces have been very nice. On the chart above, there were several opportunities to dip buy. But it’s key to know how to read the turns. See my TSNP trades here.*
Here’s another…
Alternet Systems, Inc. (OTCPK: ALYI) February 10, 2021
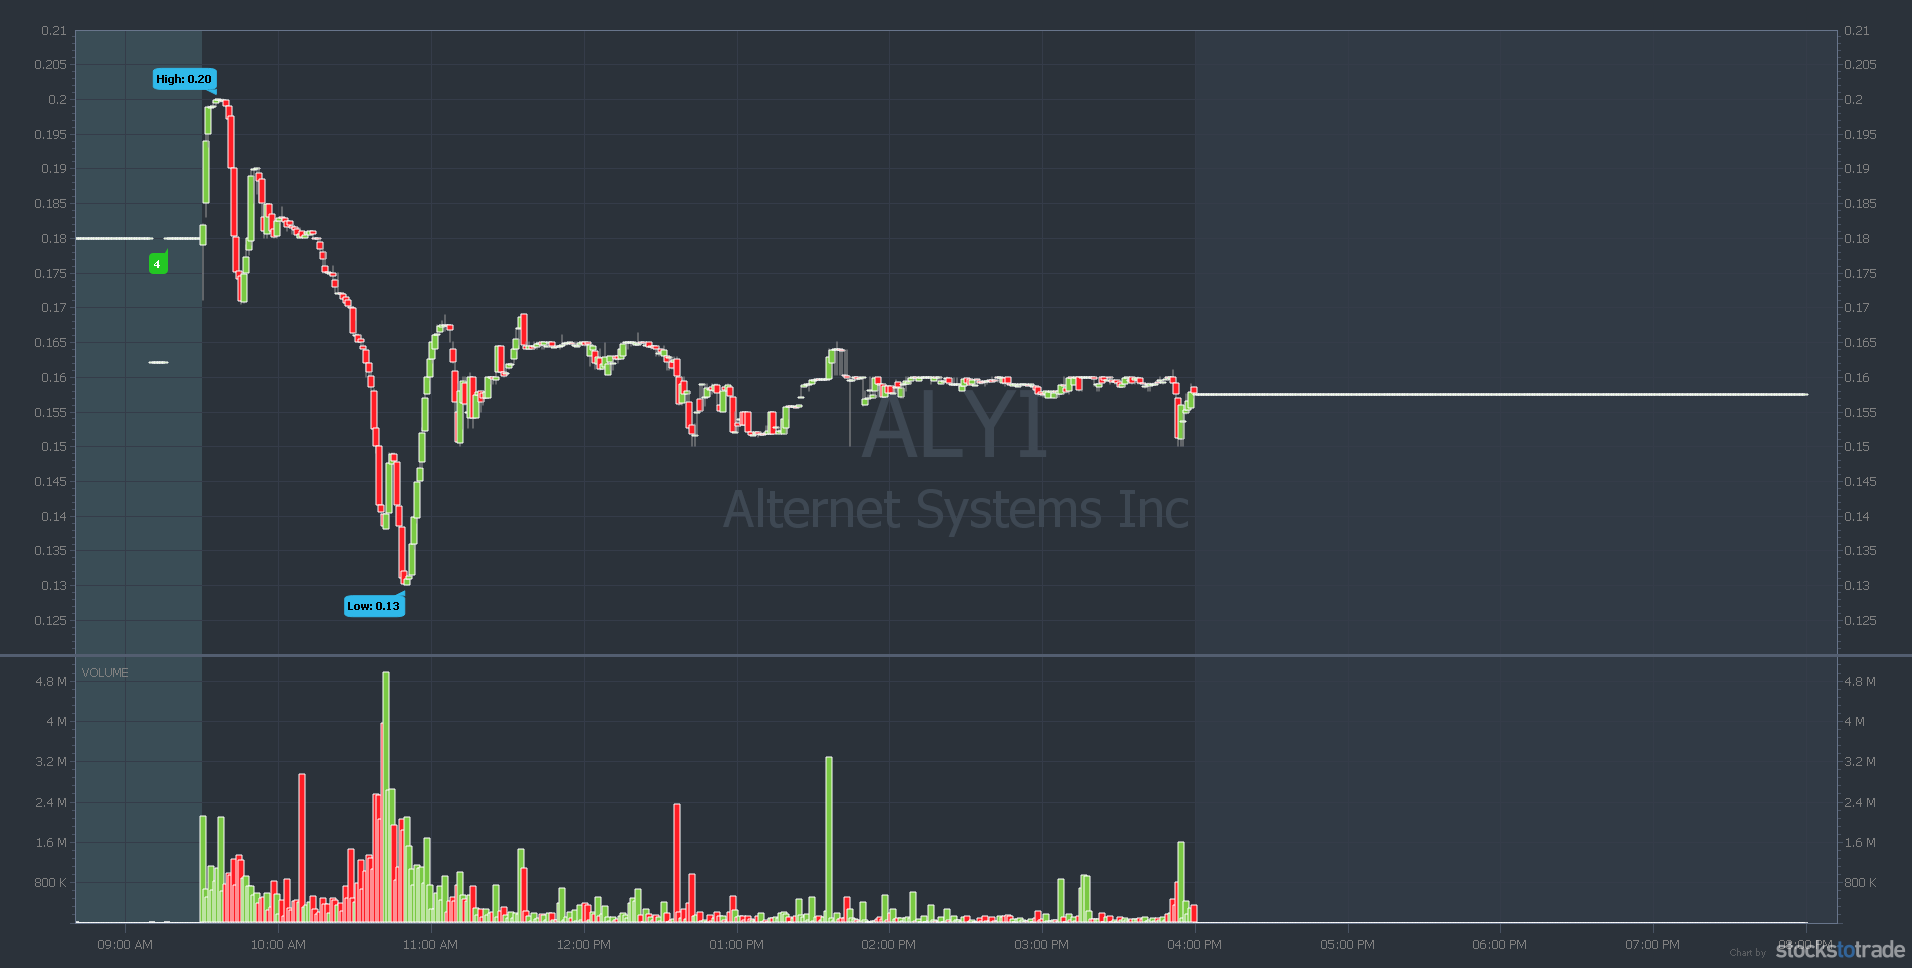
Notice ALYI spiked at the open, then panicked. That’s a variation on the pattern. (Keep reading to see more examples of this variation.) Then it bounced and panicked again. It looks like a bouncing ball. That kind of volatility offers a lot of opportunity for traders.
Here’s another…
Barrel Energy Inc. (OTCPK: BRLL) February 12, 2021
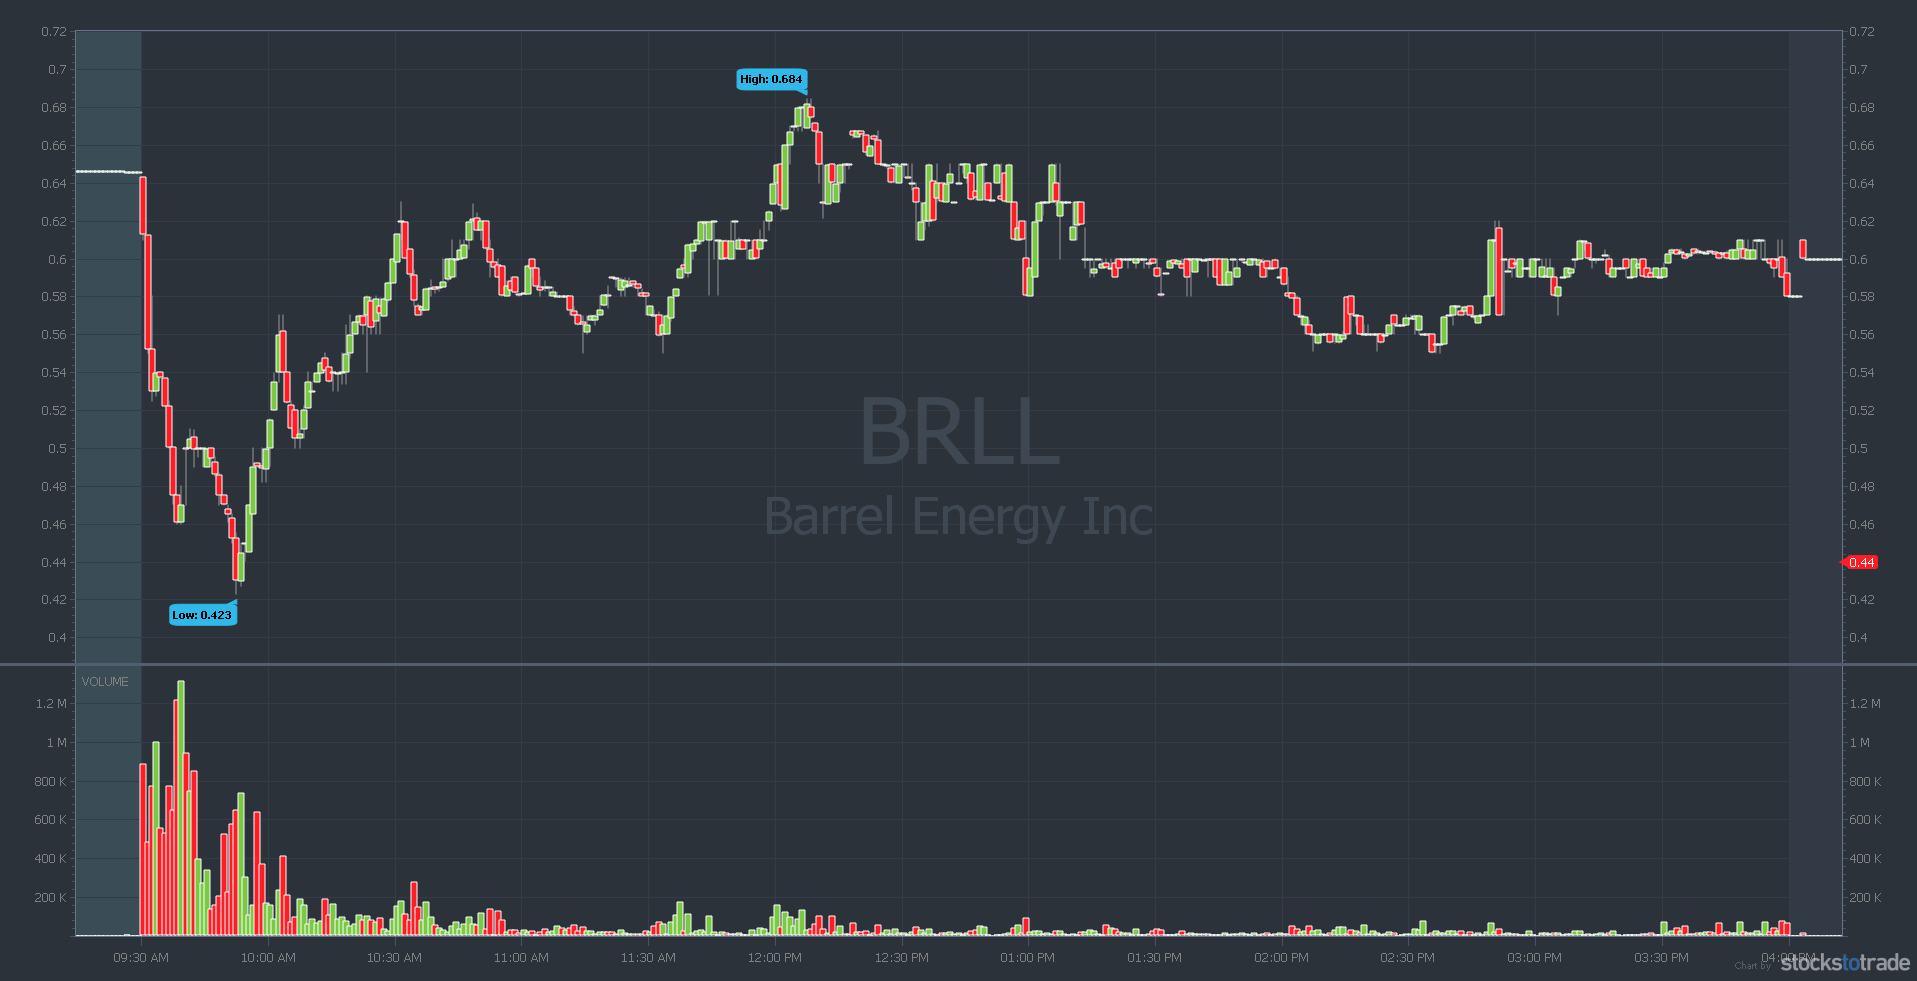
Notice the small fake-out turns? (The short green candles on the way down.) Learn to recognize fake-outs. If you do get in early, cut losses quickly. Many stocks never bounce. Others don’t bounce as much as BRLL.
Take a look at this beauty…
Medical Marijuana, Inc. (OTCPK: MJNA) February 12, 2021
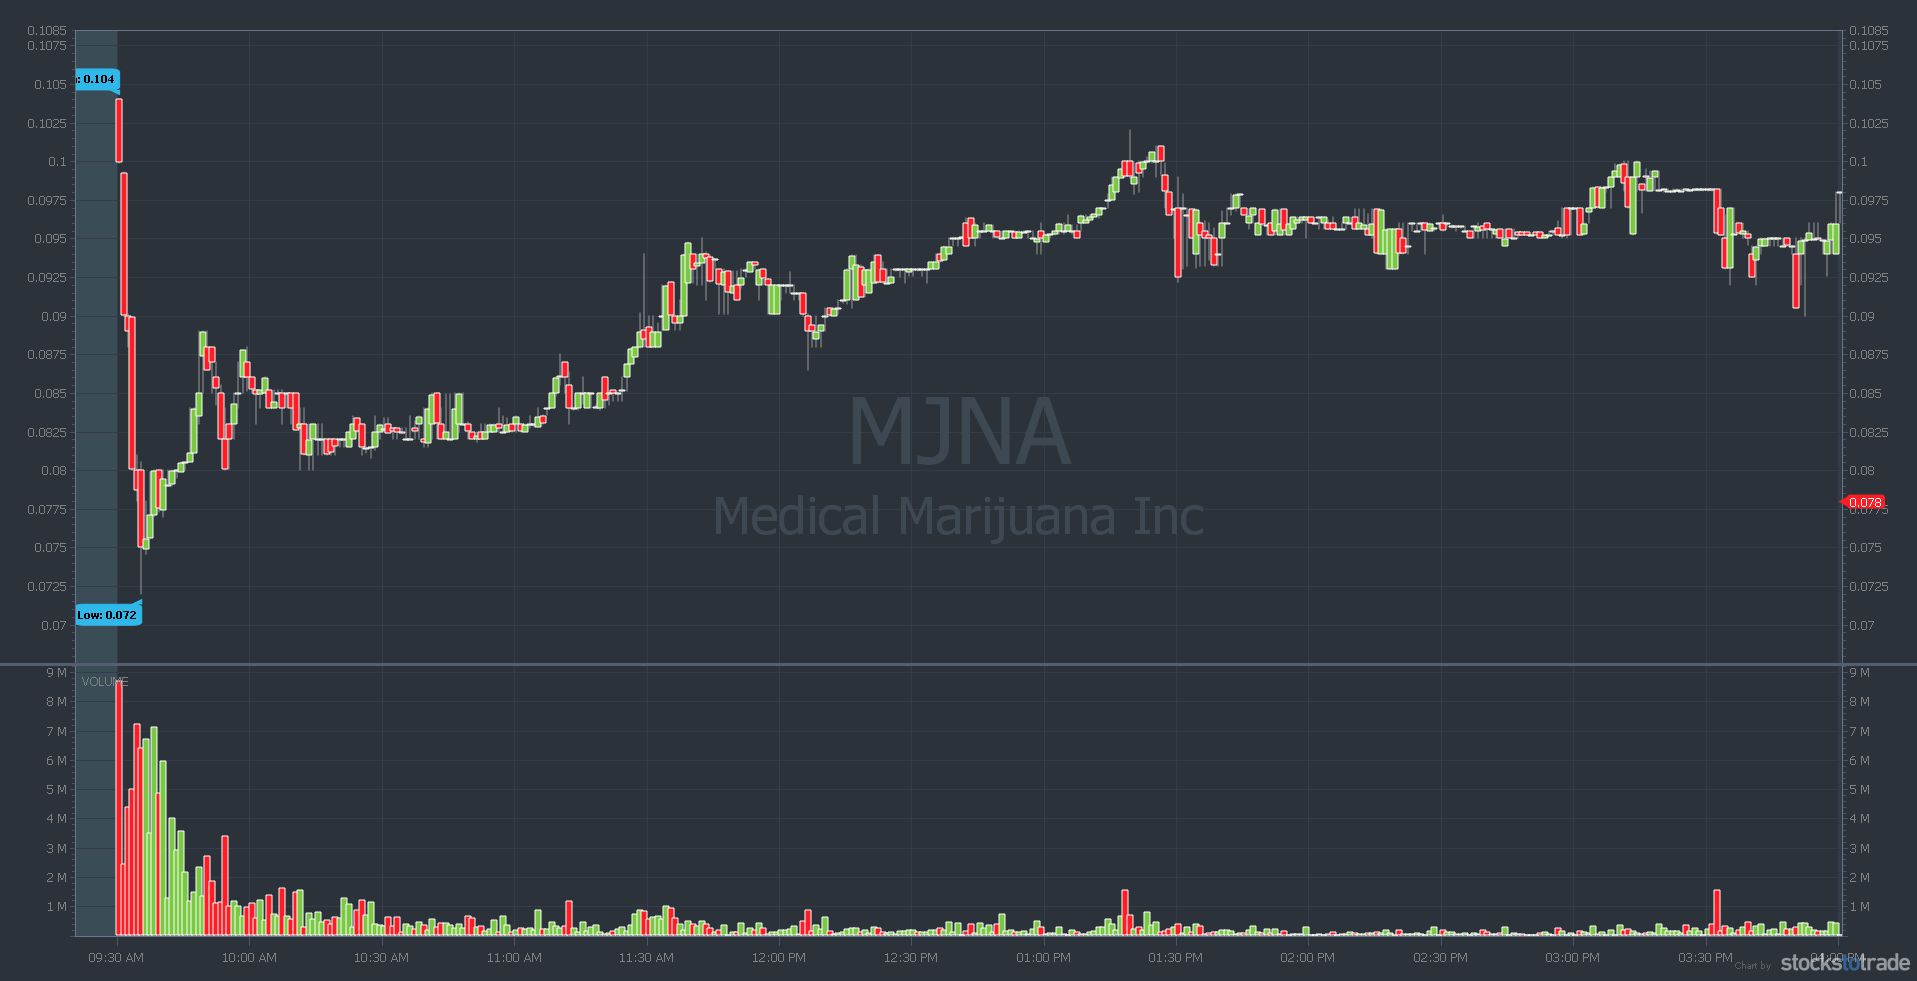
MJNA had a stunning panic at the open — dropping 44% in under six minutes. Crazy. You had to be quick. I traded both MJNA and BRLL that day but cut MJNA. It’s tough to focus on more than one trade at a time. BRLL seemed like the better opportunity to me.
Here’s another TSNP panic…
Tesoro Enterprises, Inc. (OTCPK: TSNP) February 17, 2021
What a beautiful morning panic! But there were two fake turns and I got caught. I bought at the first fake turn and averaged down on the second. I took a loss — only to watch it finally bottom and bounce 20% in under 30 minutes. I wouldn’t have had the patience to hold through it, but the opportunity was there.
During my Trading Challenge webinar last week, a student asked a question about the trade…
Profit.ly user @scaredcynical asked, “Tim, why not get back in TSNP once you entered too early and got out for a small loss?”
Because I’m second-guessing myself. When I’m too early it messes with my mindset. If I tried again, would it be for the right reasons? Or would it be a revenge trade? I’m happy I was on the right track even though I was early.
Asia Broadband, Inc. (OTCPK: AABB) February 18, 2021
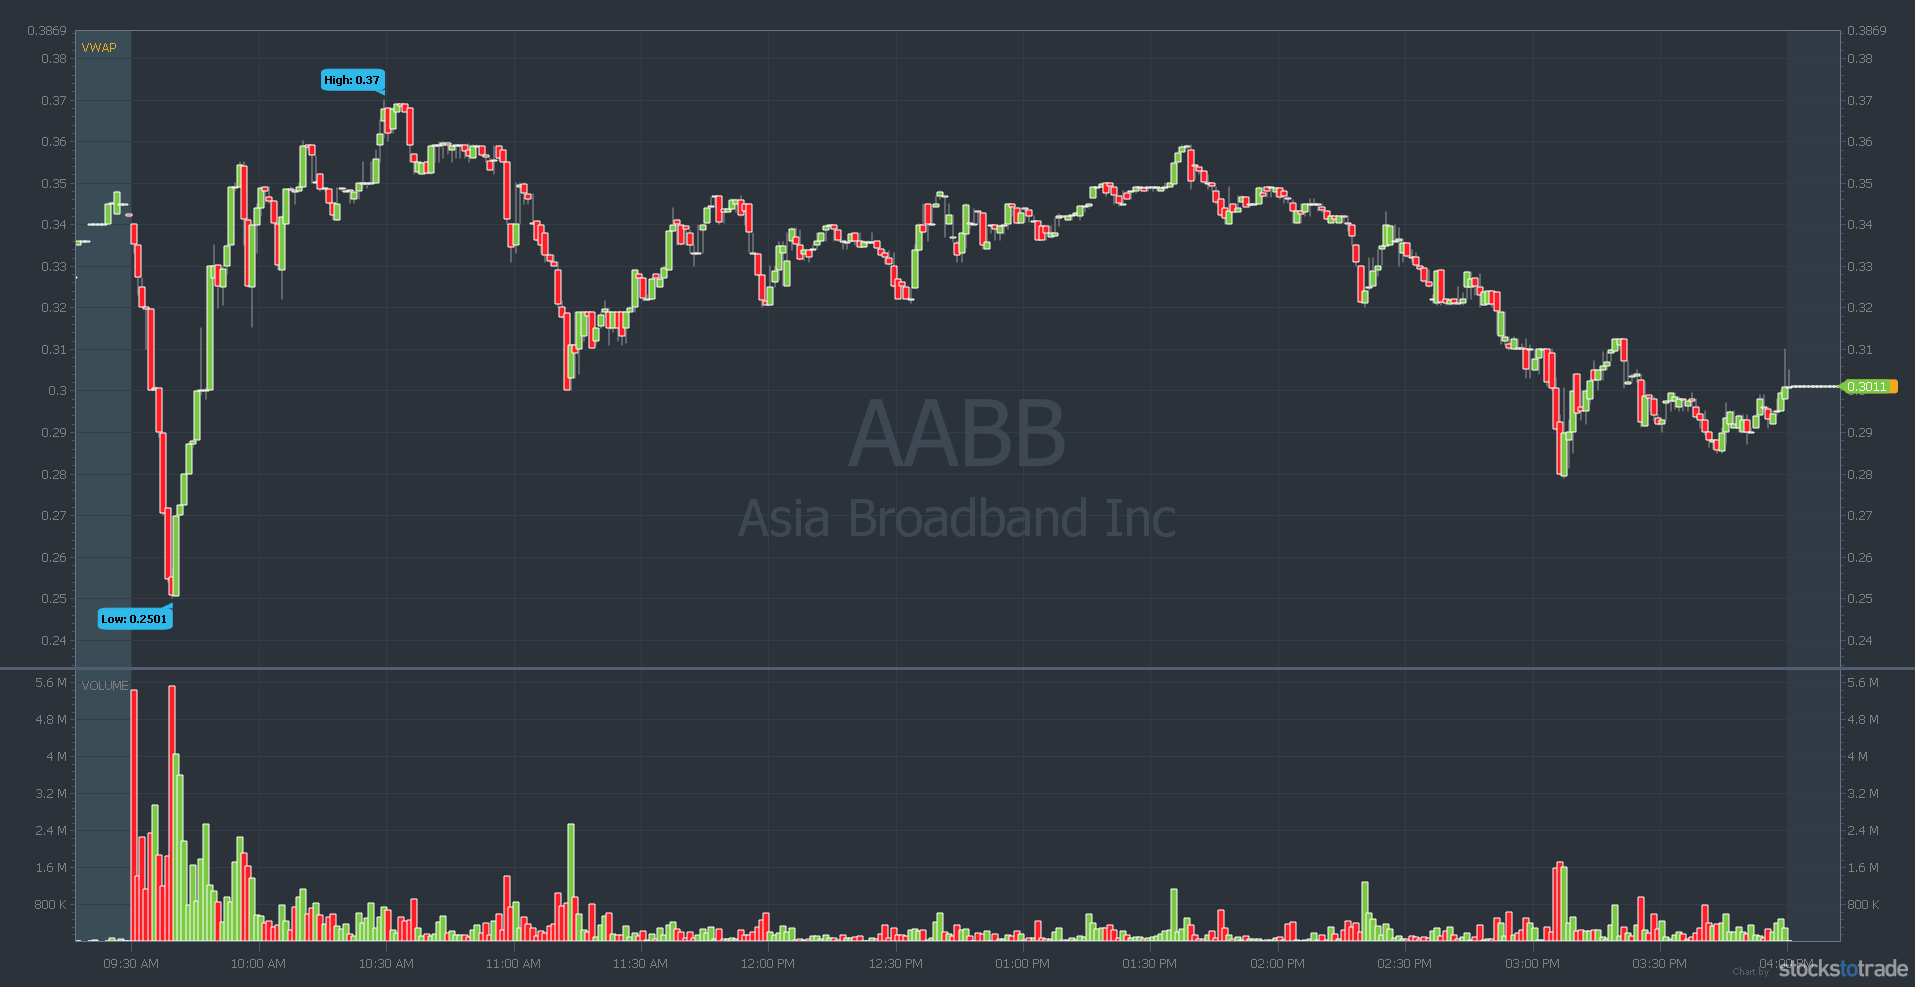
AABB had a near-perfect panic and bounce. It took only nine minutes to drop 26%. Then it bounced roughly 42% in just over 15 minutes. I called this one during my Trading Challenge webinar on February 17. AABB was still up a lot but closed weak. It looked like the morning panic was a strong possibility.
Here’s a bitcoin-related stock that had a nice morning panic…
Bitcoin Services, Inc. (OTCPK: BTSC) February 18, 2021
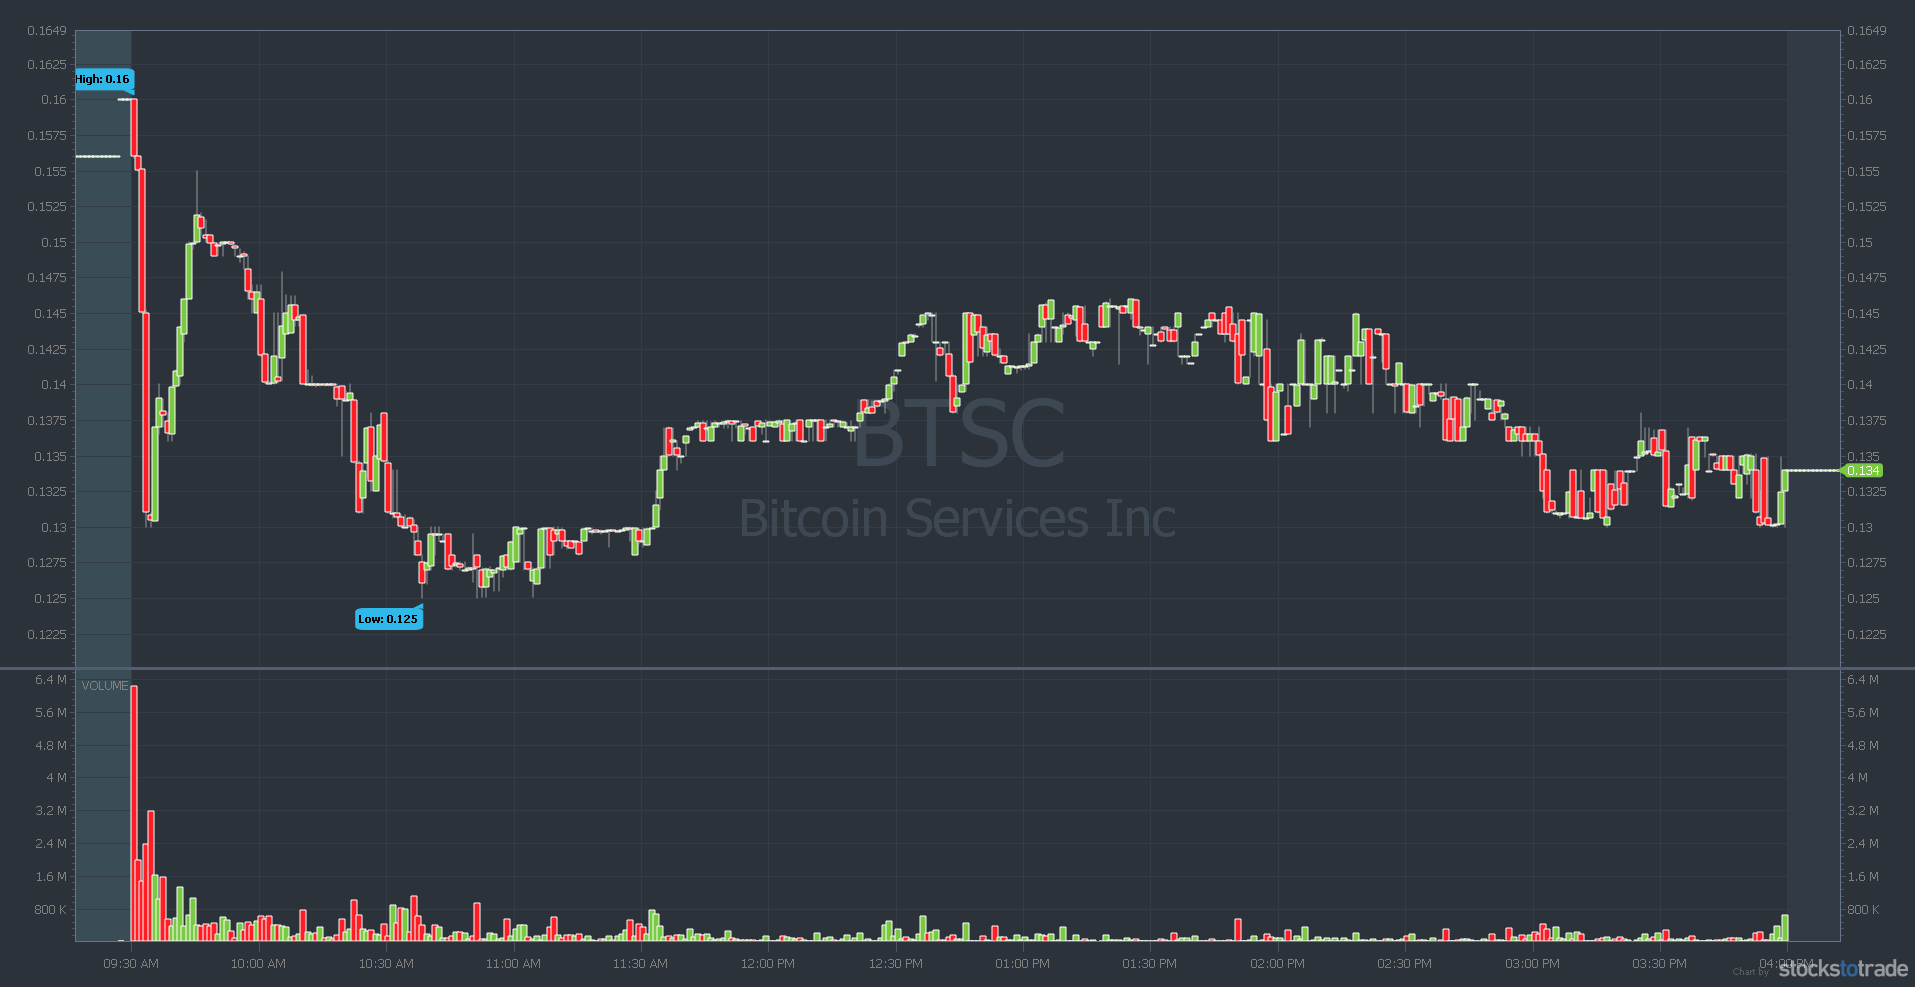
BTSC didn’t panic as much as AABB, but it was faster. It took six minutes to panic and bounced 23% in 11 minutes.
Ozop Energy Solutions, Inc. (OTCPK: OZSC) February 18, 2021
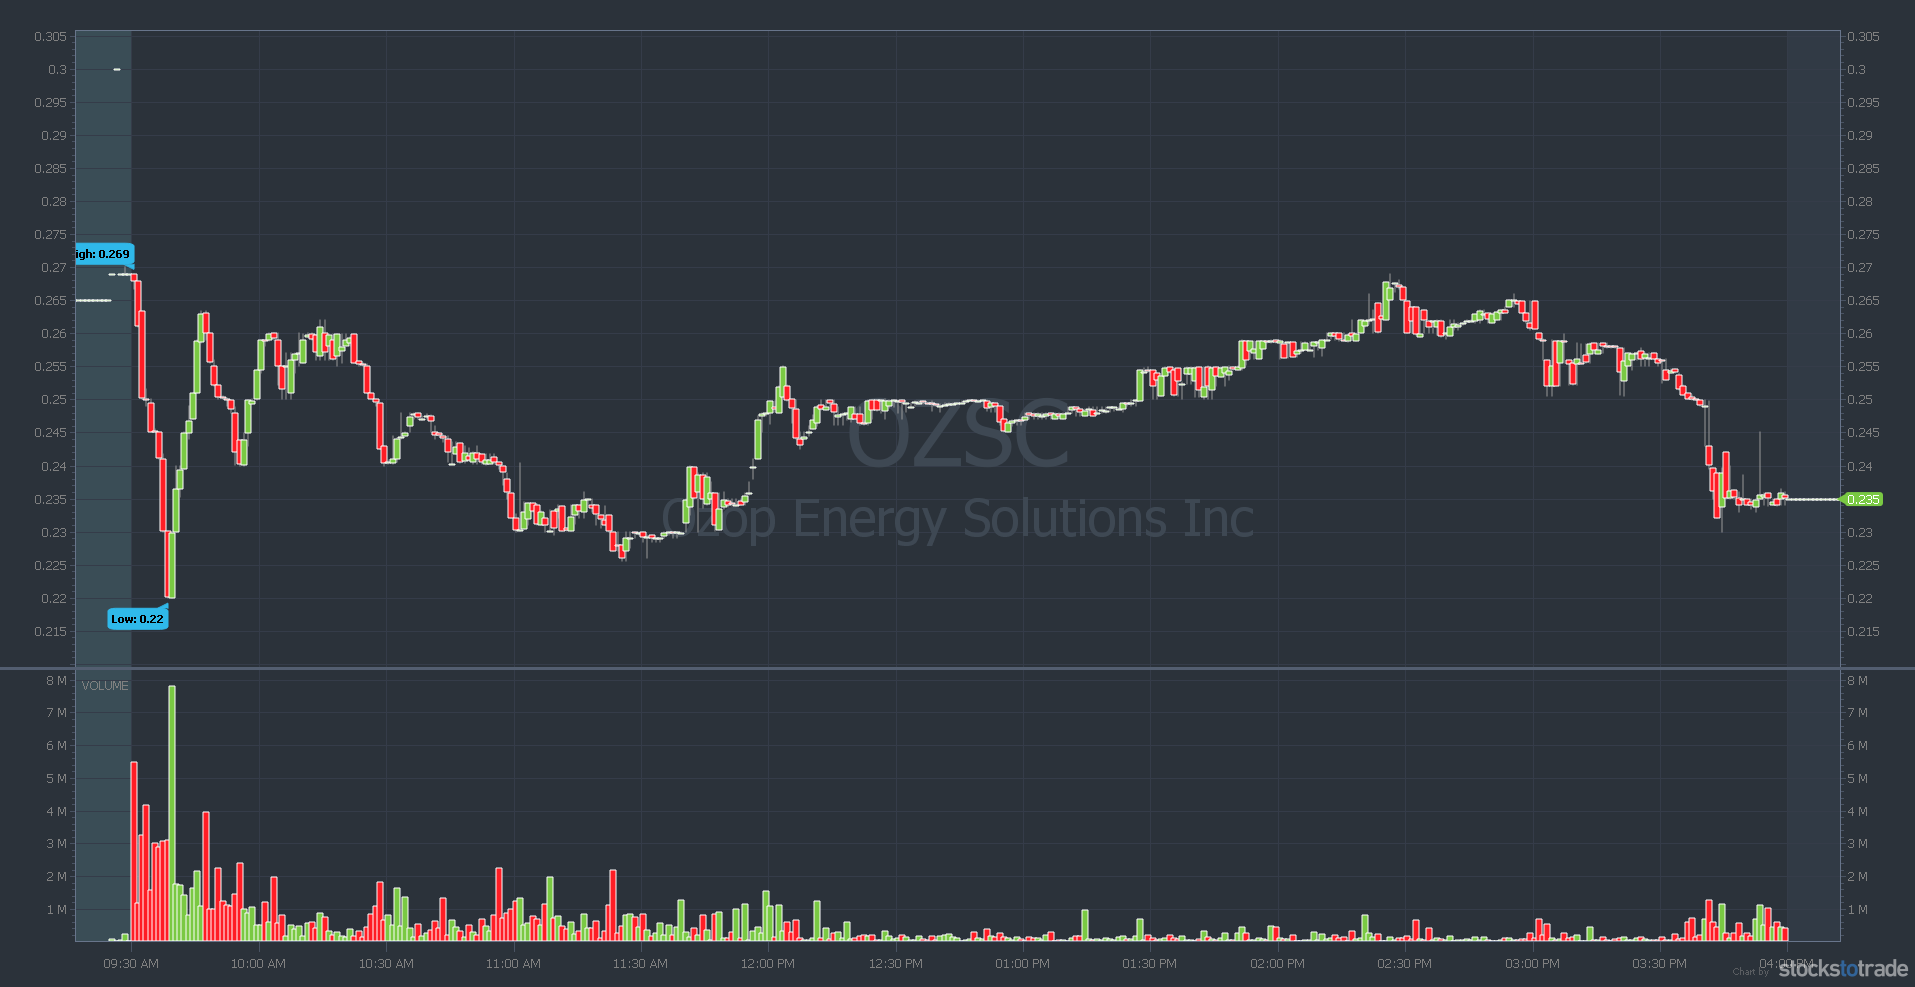
OZSC was another clean morning panic. Is the stock chart pattern burned into your brain yet?
Is This the Best Penny Stock Pattern?
Is panic dip buying the best penny stock chart pattern? The answer depends on you. Many students are focusing on panic dip buys in this crazy market. Three of the four traders featured in this student spotlight roundtable prefer panic dip buys. But some traders prefer other patterns.
Regardless of whether it fits your trading style, it’s been a consistent pattern recently. The crazy thing is, there are variations…
Learn to Recognize Variations of This Stock Chart Pattern
As you saw from the charts above, it’s not an exact science. Here are two charts where the stock had a morning spike before the panic and bounce…
Cannabis Strategic Ventures (OTCPK: NUGS) February 10, 2021
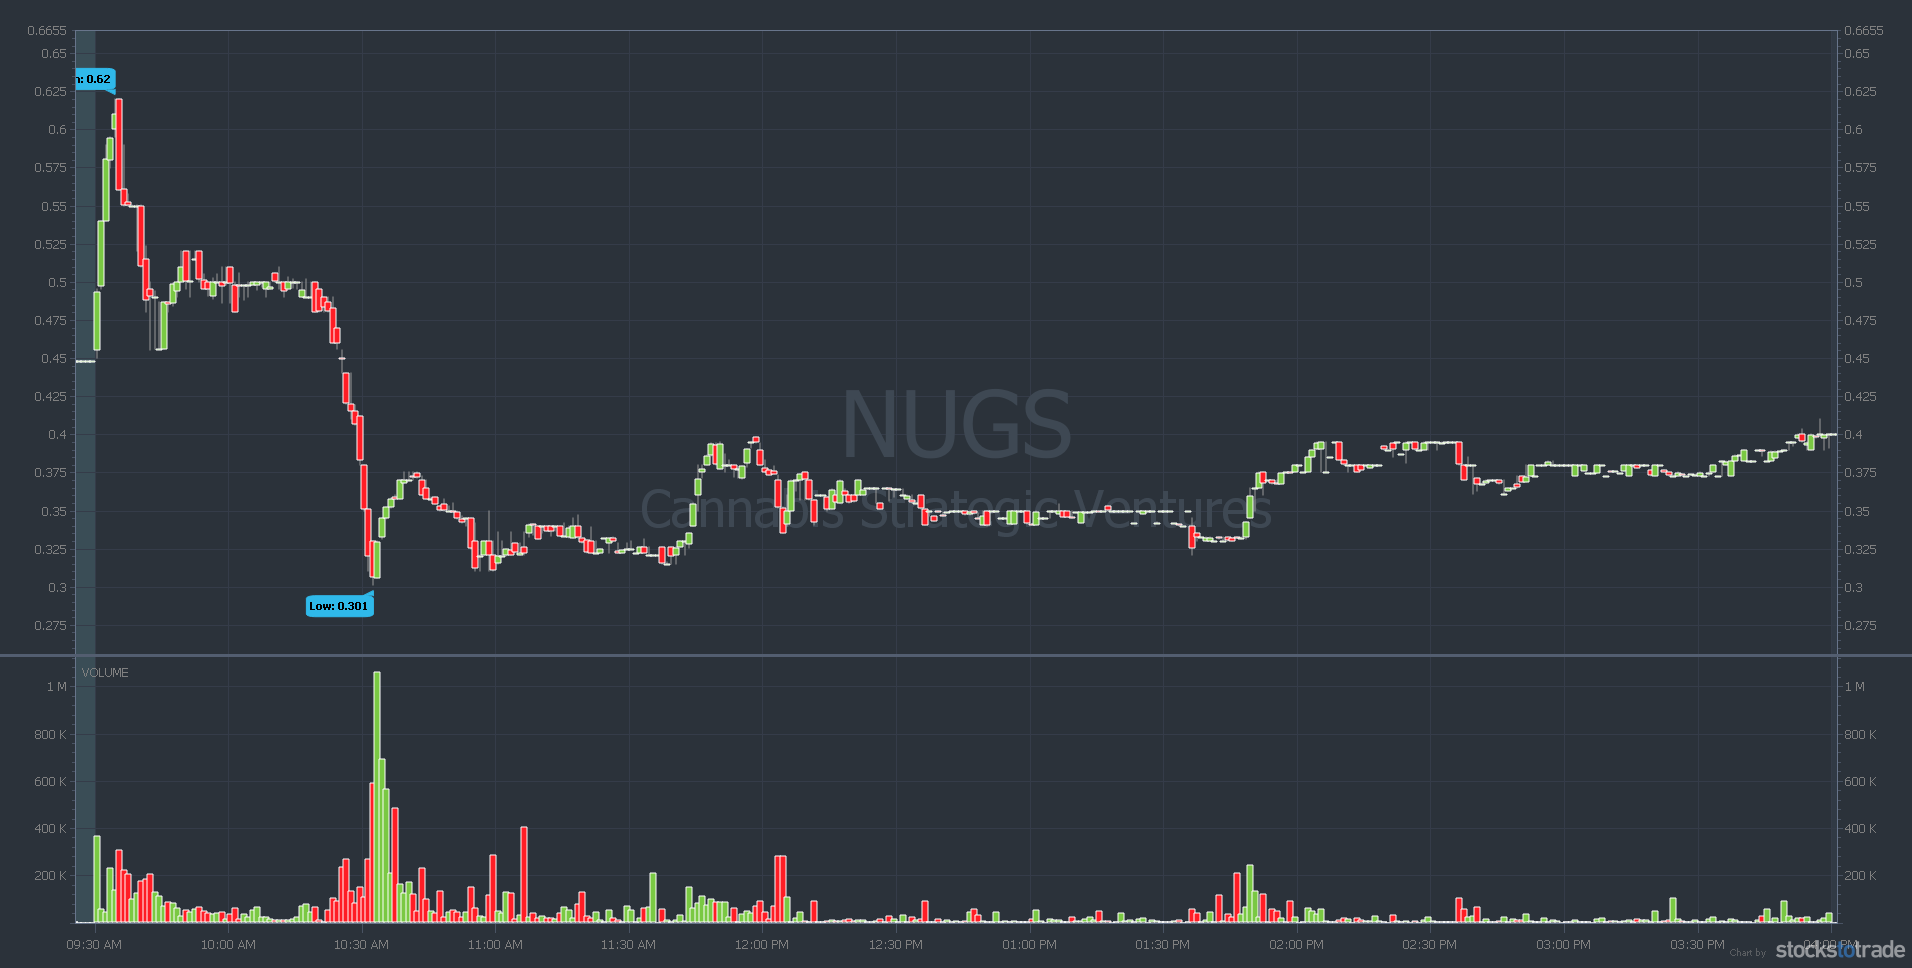
As you can see, NUGS spiked at the open, panicked, and had a little bounce. Then it rolled off, panicked, and had another bounce. Notice the huge volume spike on the bigger panic.
Minerco, Inc. (OTCPK: MINE) February 10, 2021
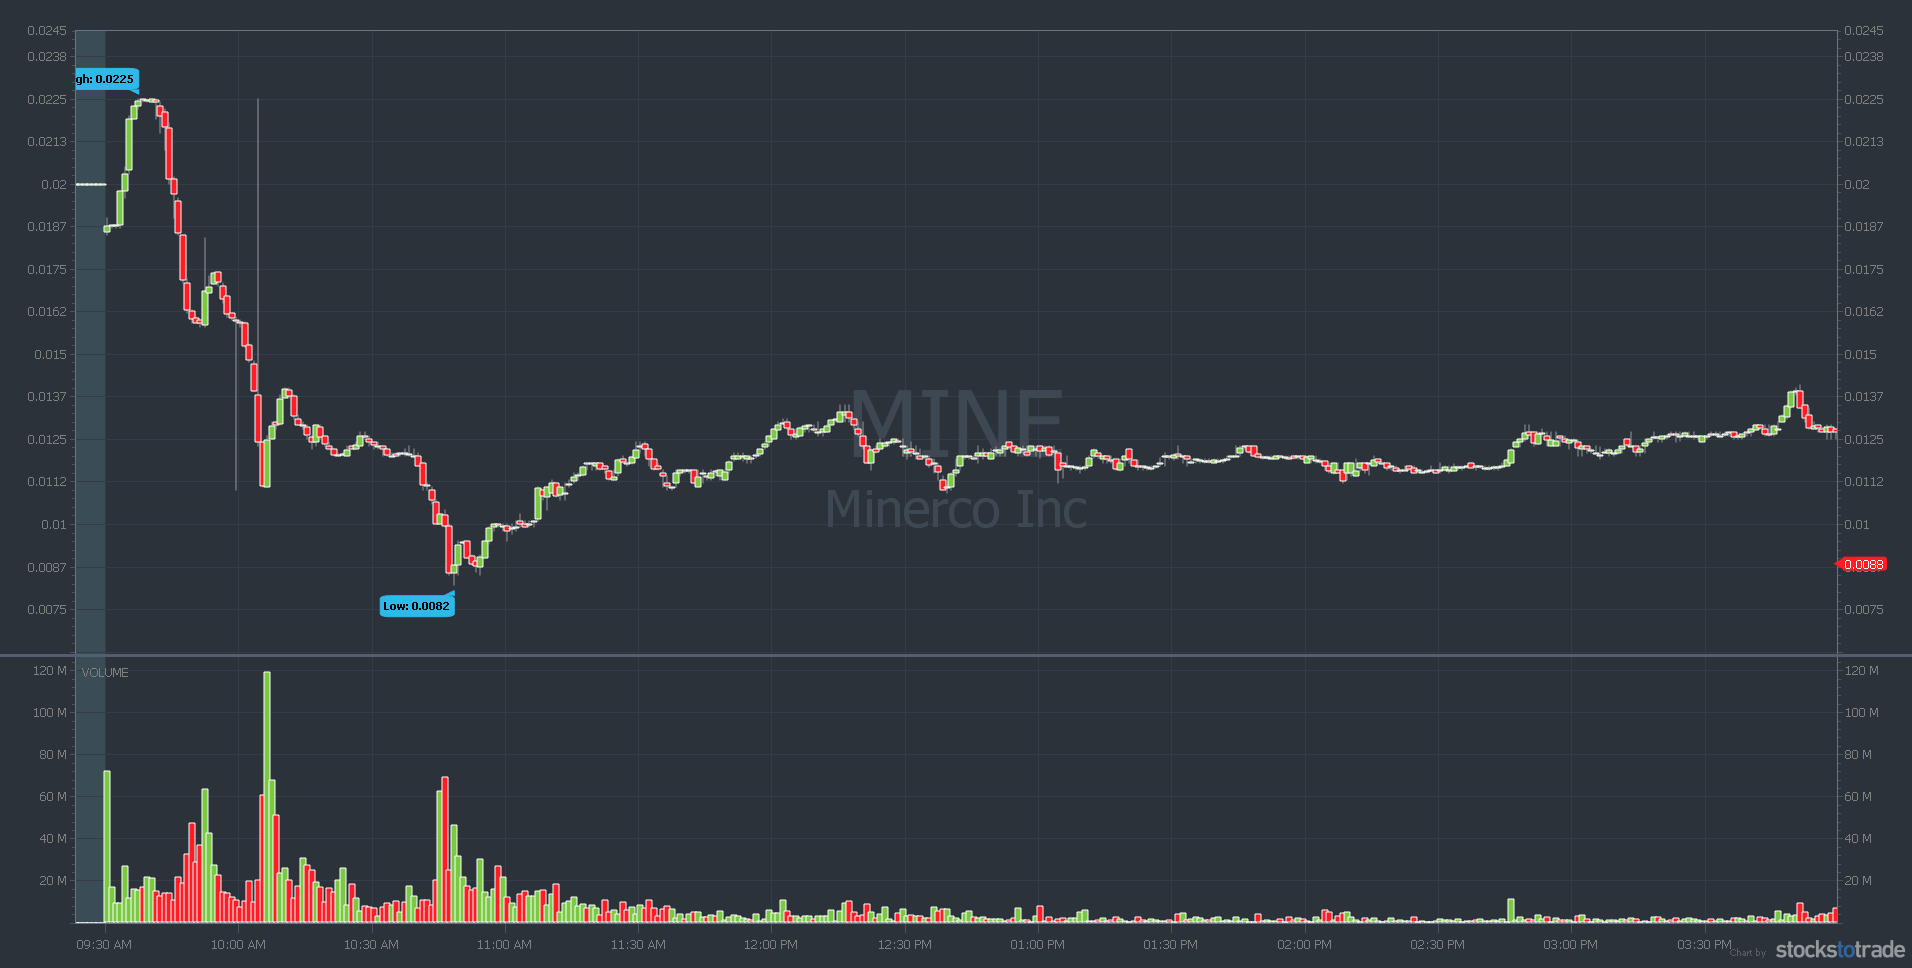
Again, MINE spiked at the open before the panic. Then there were two bounces on the way down. The volume spike on the second bounce is a useful indicator. But the real nuance comes from learning to read Level 2. (Watch my “Learn Level 2” DVD for more on reading Level 2 quotes.)
Trade Review: My Favorite Penny Stock Chart Pattern in Action
One important thing about panic dip buys, because it’s counterintuitive…
I teach students to look for big percent gainers. But my favorite penny stock chart pattern involves stocks that are often red on the day.

Look for big percent gainers over one, three, and five days. Know the big percent gainers of the past month. You should be aware of ALL the multi-day runners in the market. If, and when, they panic enough, they become potential dip buys.
It’s like buying the intraday big percent losers of the multi-day big percent gainers. And timing matters. So don’t think it’s easy. It takes practice — both to see it in real time and to execute the trade.
Here’s a trade featuring the stock chart pattern I LOVE for small accounts…
Innerscope Hearing Technologies, Inc. (OTCPK: INND)
Check out the INND chart from February 18 and 19…
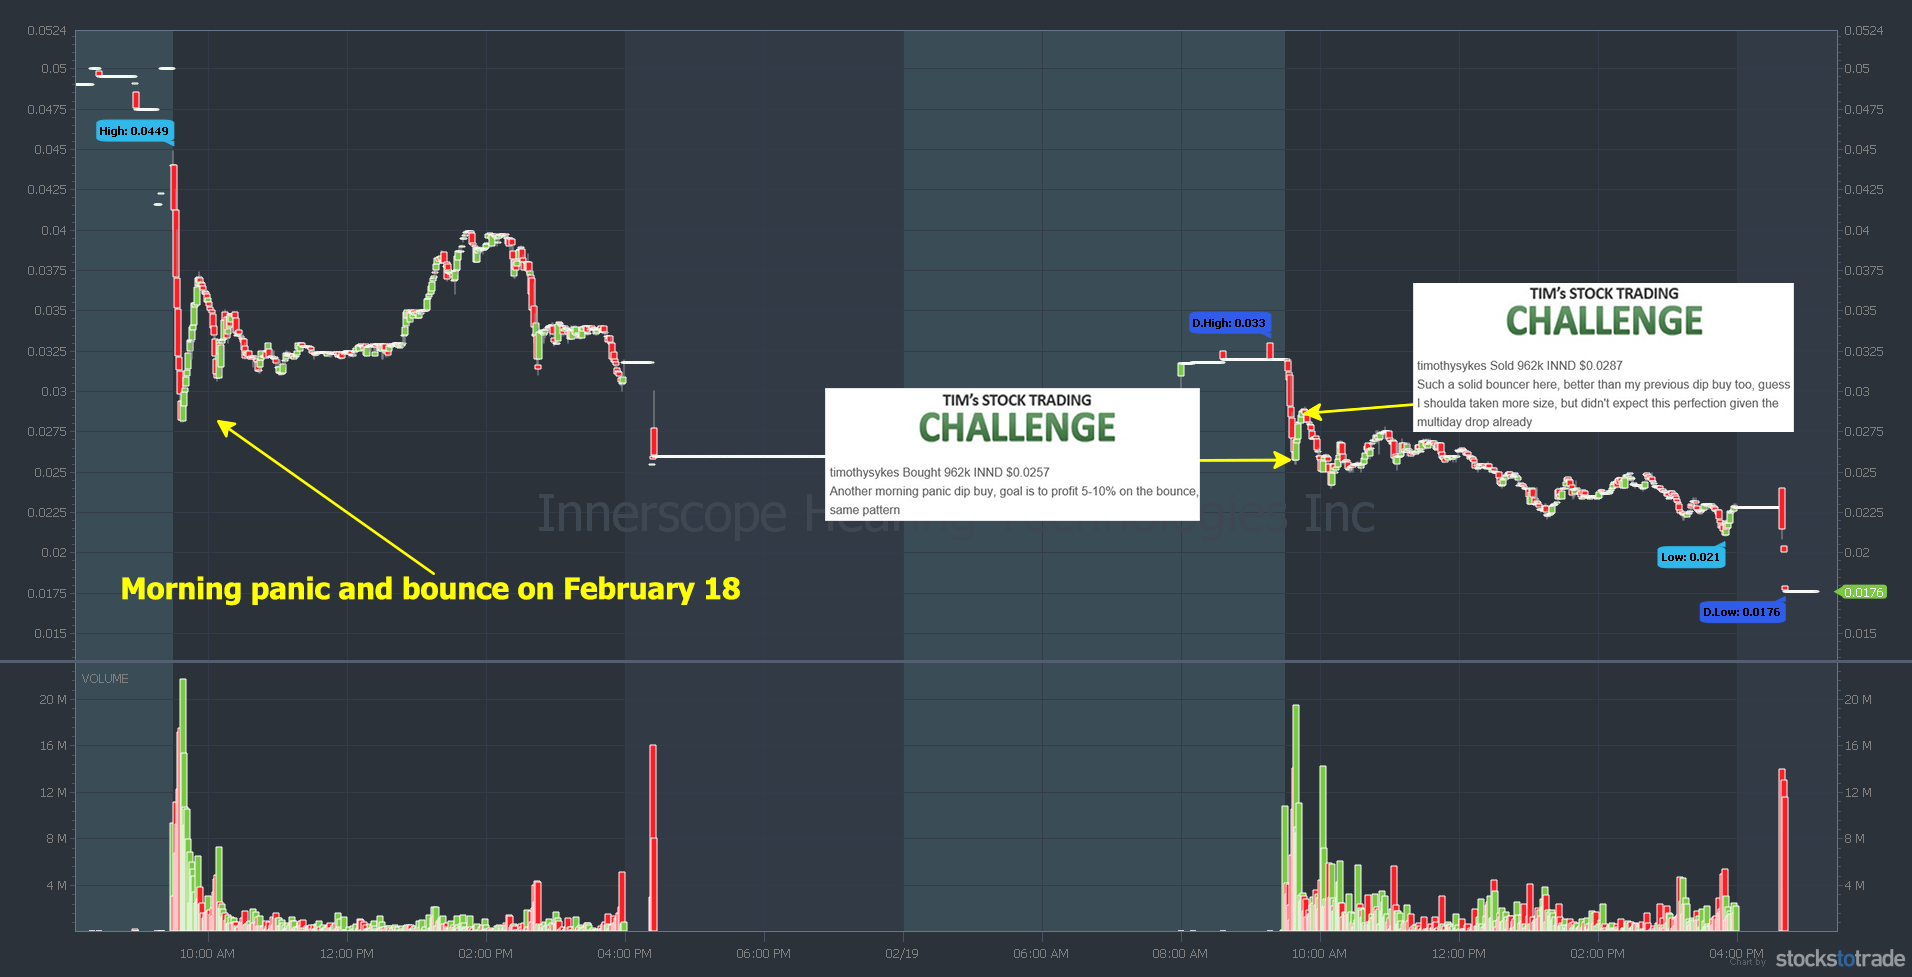
Notice INND had a morning panic and bounce on February 18. I missed it. But it showed me the stock was capable of bouncing. So when it panicked on February 19, I was ready. See details of my INND trade here.*
Is Dip Buying Panics Right for You?
Only you can decide. The best way to know if a pattern works for you is to test. Start small. Or paper trade using StocksToTrade. Remember, it takes time and experience to master this, or any, stock chart pattern.
(Quick disclaimer: I helped design and develop StocksToTrade, and I’m an investor.)
Again, look for multi-day runners that get overextended. Then learn to read the turn by watching Level 2 quotes when the panic is in.
Top tip: Reading Level 2 is more important for OTC panics. I prefer OTCs for this pattern because I find listed stocks more difficult to judge.
Finally, remember it’s as much an art as a science. You don’t have to be perfect.
Millionaire Mentor Market Wrap
It blows my mind that more people aren’t focused on learning in this bubble market. I hear people say “Let me trade! I need to trade!” NO! You should be saying “Let me study! I want to study!”
Understand where you are in your journey and capitalize on it. THAT means growing your knowledge account now. Learn as much as you can before the bubble pops. (And it will…)
If you’re learning during a bubble, that’s fantastic. You’re in the right place at the right time. Don’t look back and say, “I wish I’d been more focused on studying.”
Start here…
30-Day Bootcamp
Learn the basics of my penny stock strategies with the 30-Day Bootcamp. It’s a great place to start. It’s also solid review material for more experienced traders. (Hint: Day 16 covers panic dip buys.)
Trading Challenge
The Trading Challenge is my most comprehensive educational offering. (Hint: Trading Challenge students get access to over 700 video lessons on panic dip buys.) Come ready to study. Apply for the Trading Challenge here.
What do you think of my favorite penny stock chart pattern for small accounts? Comment below, I love to hear from all my readers!
The post Millionaire Mentor Update: My Favorite Penny Stock Chart Pattern for Small Accounts appeared first on Timothy Sykes.