(This is a reprint of the subscriber-only “DecisionPoint Alert” article from 12/22/2020. Merry Christmas & Happy New Year to all from Carl & Erin Swenlin)
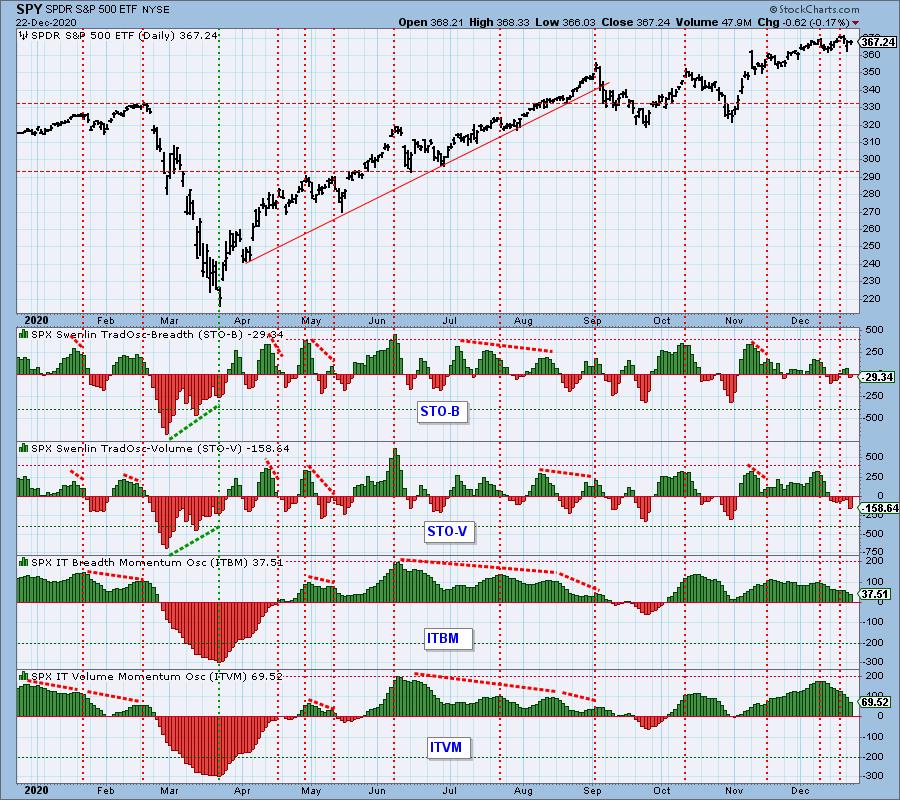
One of the ways we measure market bias is by looking at the histograms of the Swenlin Trading Oscillators (STOs) and the ITBM/ITVM. You’ll note that since the November low, we have had a strong bullish bias as represented by the “green” on the chart. We’ve seen deterioration on the STOs. Because they are short-term indicators, we’ve had a bit more bouncing around which gives us a neutral bias overall in the short term. The intermediate-term indicators of the ITBM/ITVM have been sporting a strong and solid bullish bias; however, that has changed drastically since the initial December top. I’ll talk more about these indicators individually below, but I believe it is important to see them on the same chart now and then.