It’s been a shocking rebound to many, but I believe this party is just getting started. Fortunately, we were able to see the increase in the Volatility Index ($VIX) in late-February as an appropriate warning signal and then quickly realized that much of the selling was nothing more than media-induced panic. While COVID-19 was no doubt a global health crisis, the market’s panicked reaction created so many opportunities – and the paradigm shift as a result continues to create opportunities.
On March 30th, during the extreme panic and initial recovery, I realized that we really had two different markets. By analyzing the performance of all industry groups during key periods of the pandemic, it was easy to spot the rotation that was taking place. While nearly all stocks were selling off at the opening bell, a major divergence was taking place throughout the trading day. Institutions appeared to be accumulating many stocks at depressed prices, while happily selling others all day long.
That rotation was most easily visualized by using the accumulation/distribution line, which was created by Marc Chaikin. At EarningsBeats.com, we quickly grouped the “best of the best” in a Strong AD ChartList and the “worst of the worst” in a Weak AD ChartList and these two ChartLists guided us and our subscribers for the past two to two and a half months. That rotation resulted in massive outperformance by the NASDAQ 100, which can be seen by the following price relative chart:
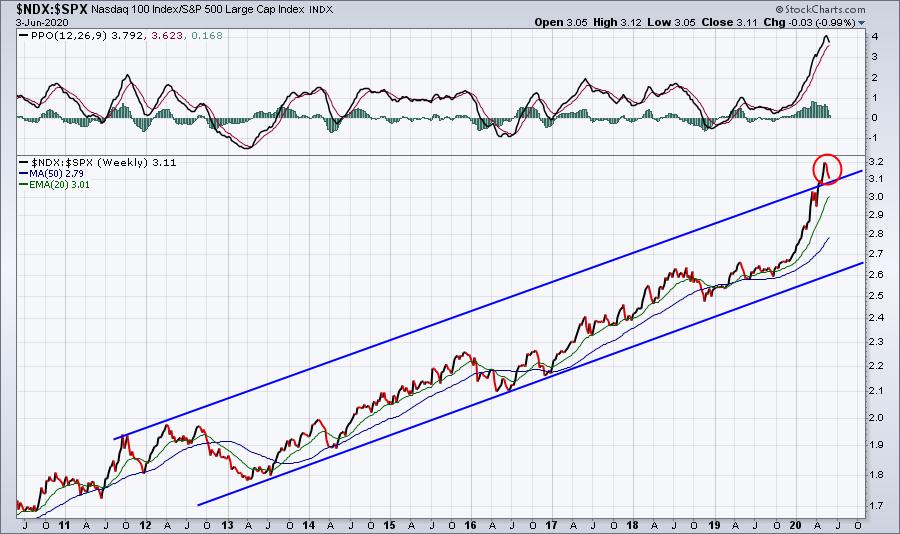
This is an overall trend that I believe will likely continue over the next few years. However, we may have seen a blowoff relative top these past few months and many traders may become frustrated with growth stocks in the very near-term as they fail to keep their relative uptrend alive. A similar long-term weekly chart showing the tremendous outperformance of growth stocks can be seen here:
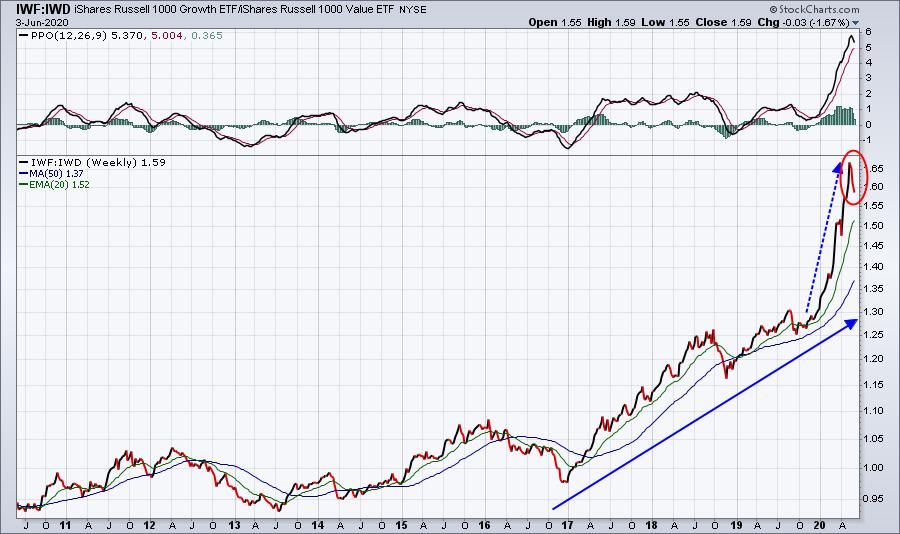
Again, I like the idea of growth stocks outperforming over the next few years, but don’t lose sight of this parabolic relative move in 2020. I expect to see, at a minimum, short-term relative consolidation. And we might see a huge relative decline to shake those out that have begun to chase this relative move.
Why could this change take place now? Well, the NASDAQ 100 threatened to break to a record all-time high close on Wednesday, but failed in the afternoon. Here’s the chart:
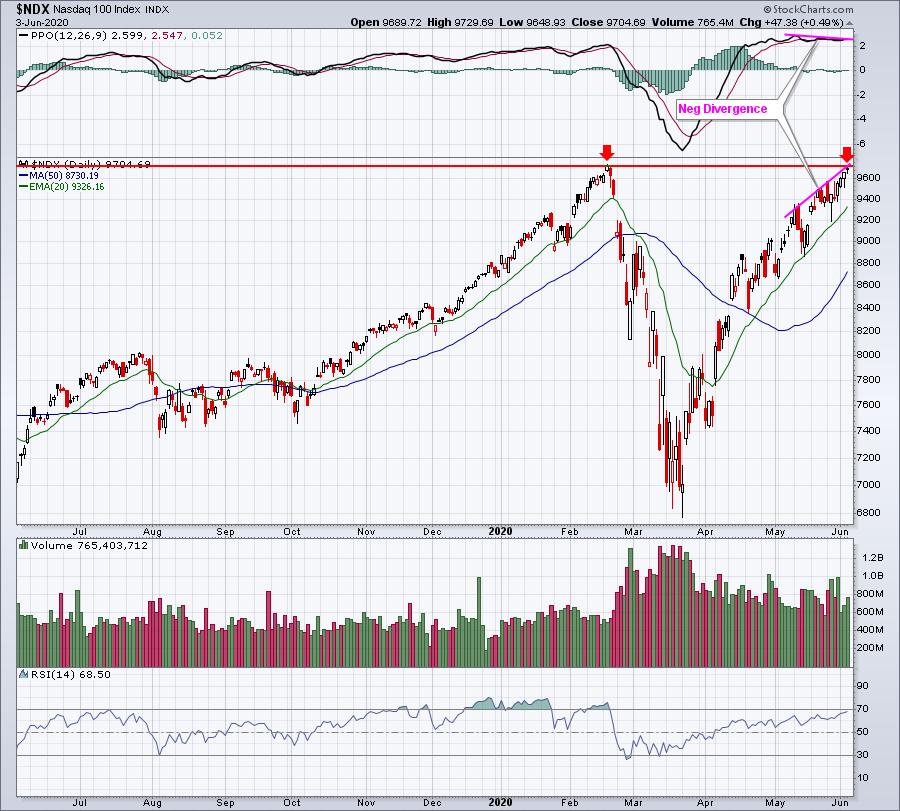
Let me be clear. I’m not bearish the NASDAQ 100 stocks. I’m actually incredibly bullish this group over the next several years. But we’ve had a huge run and key price resistance was tested yesterday. The negative divergence doesn’t help. It makes sense to be a bit more cautious at this level. Let’s see a breakout first, or perhaps just a bit more relative weakness. Great opportunities still lie ahead, but they may require a bit more patience.
In the meantime, rotation has begun into those beaten-down stocks that suffered tremendous relative weakness during the past two months. They have just begun to catch fire and my “Weak AD ChartList” is home to many of them. If you’re a StockCharts.com Extra member or above, I’ll be happy to send you a link and password and you can download this entire ChartList (268 charts) into your account. In return, I’ll simply add you to our FREE EarningsBeats.com Digest newsletter that’s published 3x a week – on Mondays, Wednesdays, and Fridays.
Send me an email at “tom@earningsbeats.com” and I’ll send you the link and password!
Happy trading!
Tom