I’ve written that bear market rallies can be sudden, severe and seductive. The move off the lows in May certainly seems to check all three boxes! Using analysis of price action, breadth indicators and volume techniques, I’ll show how the similarities between the current market upswing and the late March rally continue to build.
First, let’s review the facts based on price.
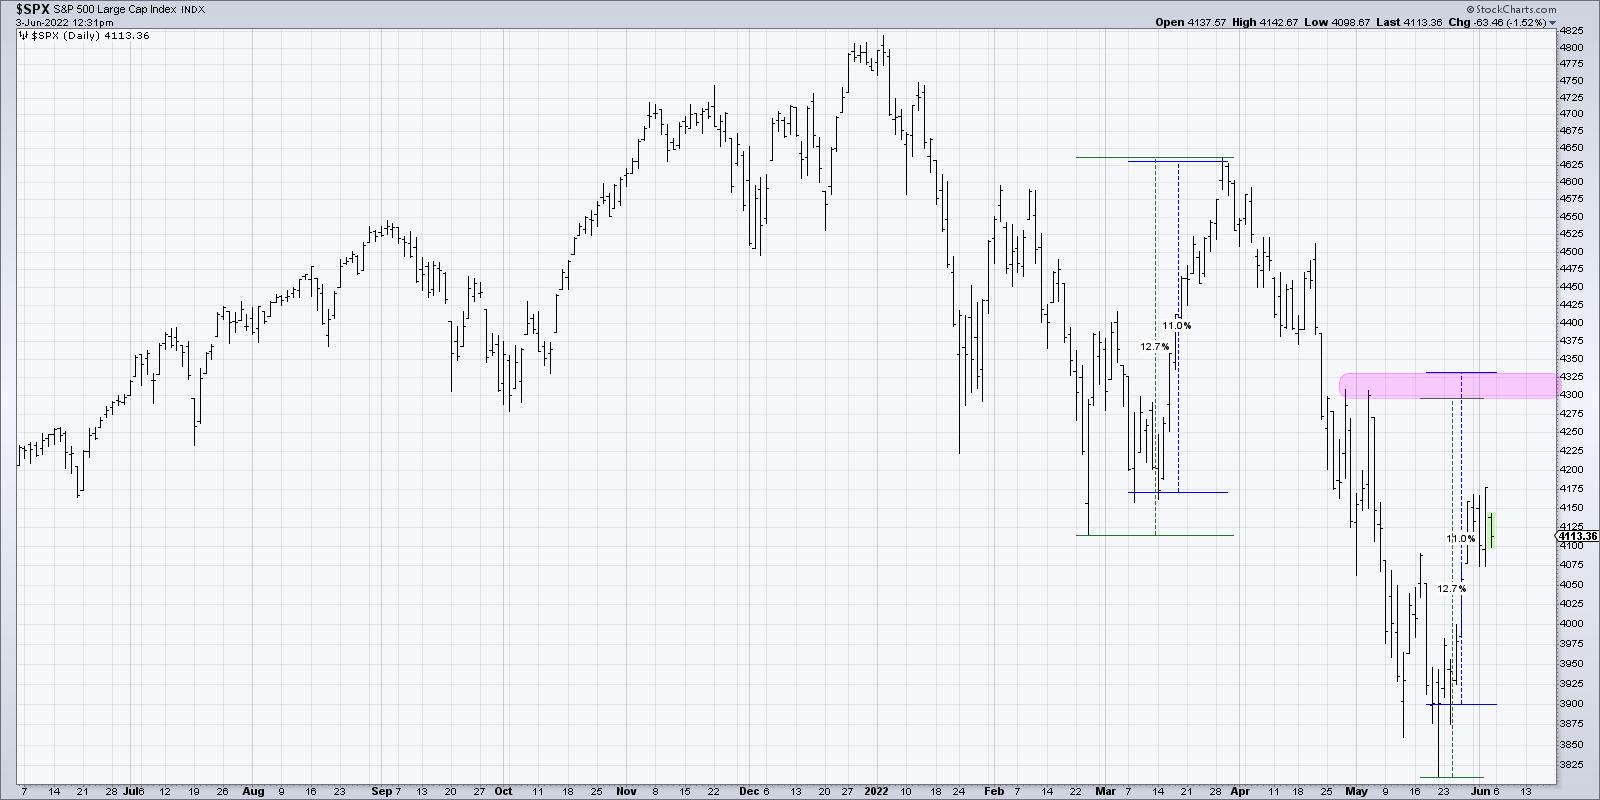
The March rally took the S&P 500 from a low around 4125 to a peak of around 4625 in about 3-4 weeks, depending on whether you measure the low from the intraday low in late February or the closing low in mid-March. This bear market rally phase pushed the S&P higher by 11.0% on a closing basis and 12.7% on an intraday basis.
How does that compare to the current rally?
We are only about three weeks in and so far the S&P is up about 6.5% on a closing basis. For a similar upswing to the March rally, that would measure up to the 4300-4325 range. This would bring us right back to the swing high in late April/early May and would also represent a 50% retracement of the January to May decline.
What can the volume tell us about market sentiment? If we simply look at the trend in daily volume bars, you’ll notice a classic bear market configuration.
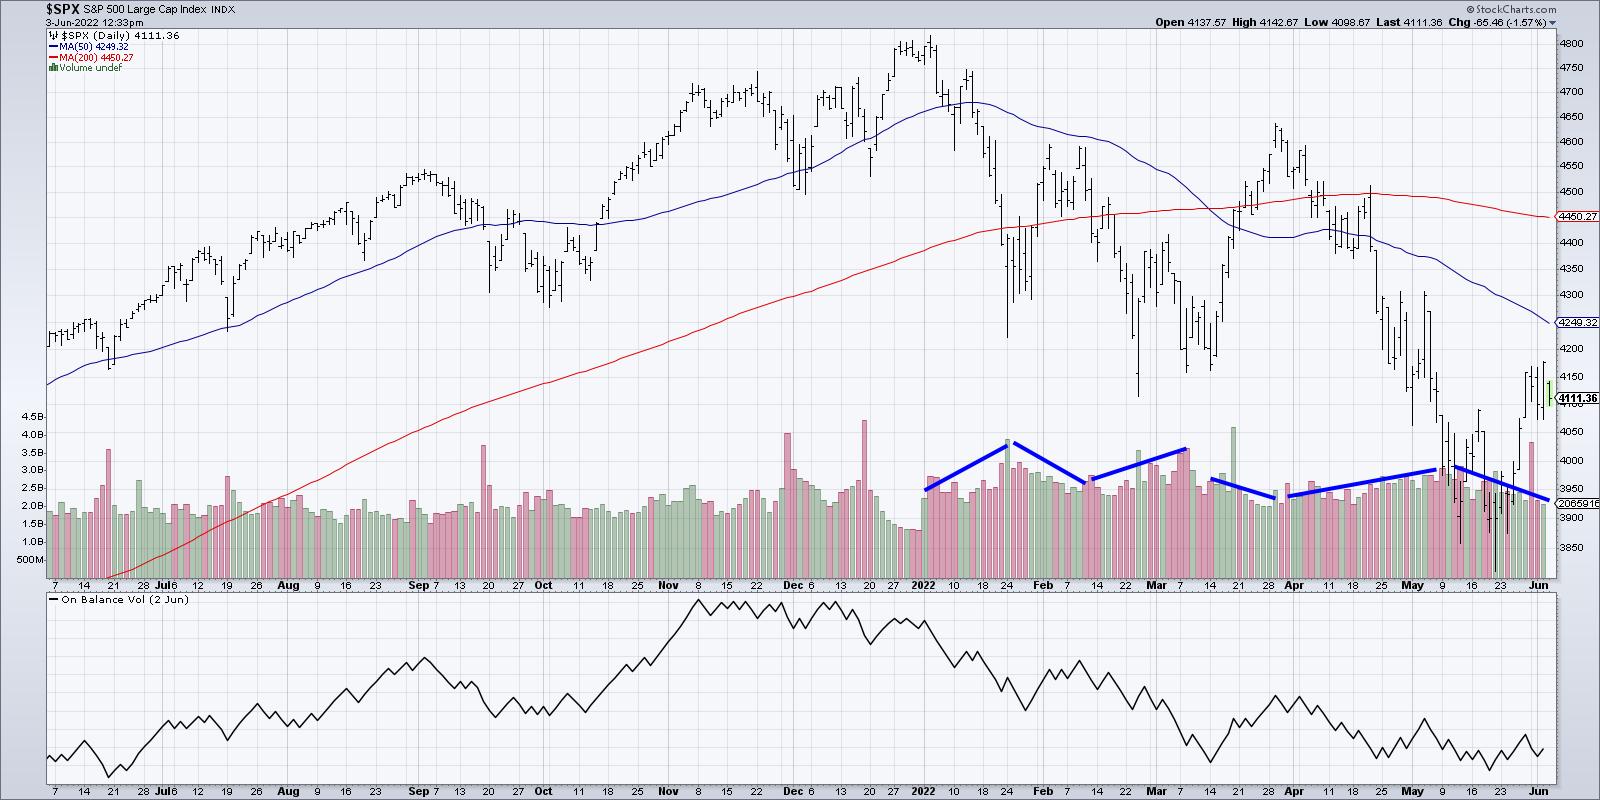
Volume has been trending higher in downtrend legs and has been lighter on rallies. So basically, selling pressure has been palpable to push the S&P to new lows, and then limited buying power comes in to push the index in a countertrend move higher. In particular, the volume readings over the last two weeks have been very similar to the anemic volume witnessed in late March.
Finally, we have market breadth. What can this tell us about participation in this rally by individual stocks?
As of Thursday’s close, 45% of the S&P members were above their 50-day moving average. In late March, that indicator reached all the way up to 70%, which showed that many individual stocks had regained their footing and participated in the uptrend.
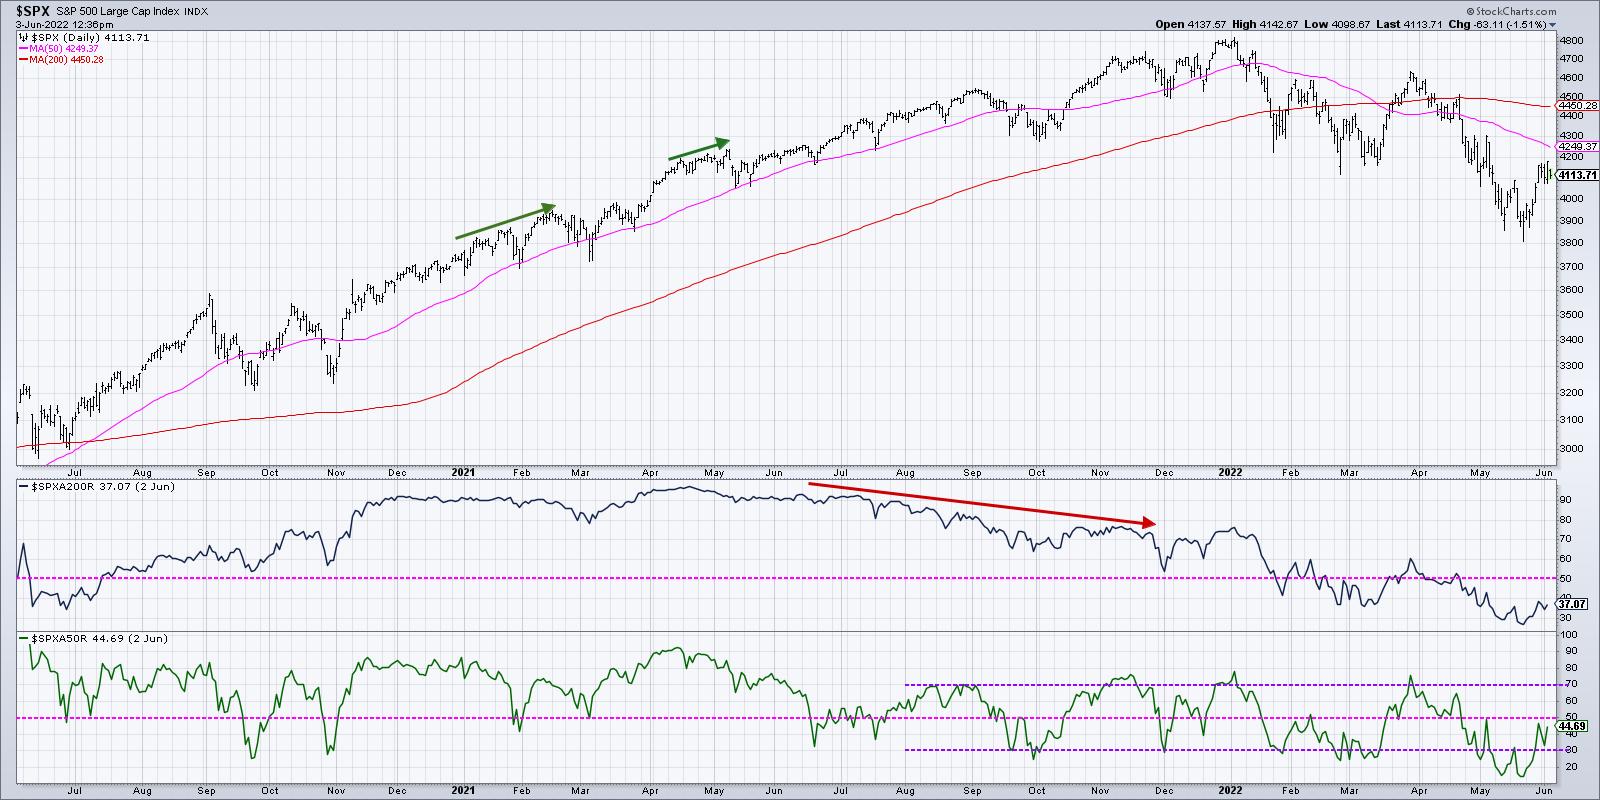
Do we need more stocks to eclipse their 50-day moving average before the bear market rally is completed? Perhaps. Although there is no guarantee that the current bear market rally would look anything like the one from late March. But I do think making simple comparisons like this can help put the current market into proper context.
As an alternate hypothesis, what if this week’s rally is more like early February? In that case, the S&P rallied 6-9% depending on whether you measure from the intraday low or the closing low.
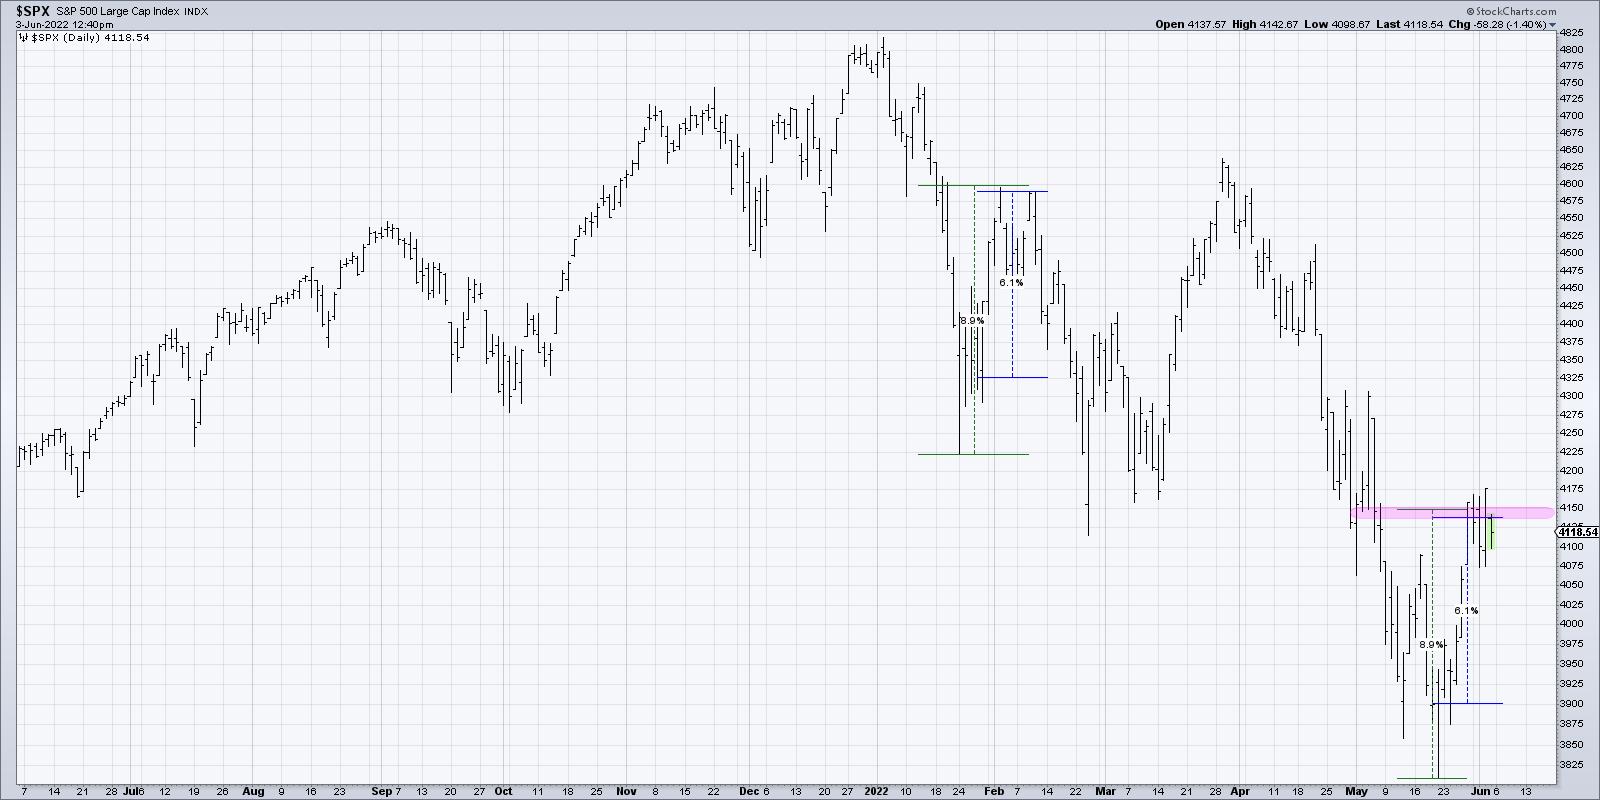
If you do a similar measurement from last month’s lows, then that would suggest we reached the potential top last Friday. The rest of this week has been about consolidating at that upside objective.
If you look at the breadth conditions and volume trends, you’ll see that they line up pretty well. The markets never repeat themselves, but they often rhyme. By comparing the current move to previous similar conditions, we can start to think about what may be similar or different from those previous occurrences.
Whether we are more closely tracking the early February rally or the uptrend in March, I am fairly comfortable in labeling this a bear market rally. Bulls have much more to prove before this market can be given an “all clear” with a bullish outlook.
Want to learn more about the 50-day and 200-day moving averages? Head over to my YouTube channel!
RR#6,
Dave
P.S. Ready to upgrade your investment process? Check out my YouTube channel!
David Keller, CMT
Chief Market Strategist
StockCharts.com
Disclaimer: This blog is for educational purposes only and should not be construed as financial advice. The ideas and strategies should never be used without first assessing your own personal and financial situation, or without consulting a financial professional.
The author does not have a position in mentioned securities at the time of publication. Any opinions expressed herein are solely those of the author, and do not in any way represent the views or opinions of any other person or entity.