Container traffic gives us an idea about the volume of goods being exported and imported – and usually some hints about the trade report since LA area ports handle about 40% of the nation’s container port traffic.
The following graphs are for inbound and outbound traffic at the ports of Los Angeles and Long Beach in TEUs (TEUs: 20-foot equivalent units or 20-foot-long cargo container).
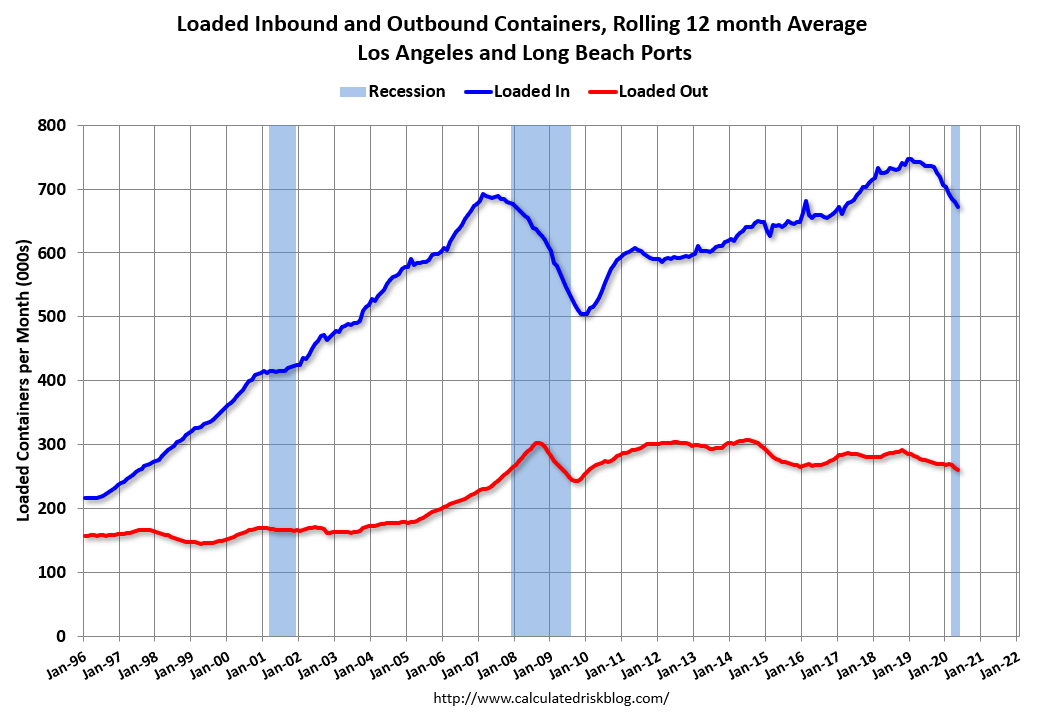
To remove the strong seasonal component for inbound traffic, the first graph shows the rolling 12 month average.
 Click on graph for larger image.
On a rolling 12 month basis, inbound traffic was down 1.2% in May compared to the rolling 12 months ending in April. Outbound traffic was down 1.5% compared to the rolling 12 months ending the previous month.
The 2nd graph is the monthly data (with a strong seasonal pattern for imports).
 Usually imports peak in the July to October period as retailers import goods for the Christmas holiday, and then decline sharply and bottom in February or March depending on the timing of the Chinese New Year (January 25th in 2020).
Because of the timing of the New Year, we would have expected traffic to decline in February without an impact from COVID-19, but bounce back in March and April.
Imports were down 14% YoY in May, and exports were down 17% YoY.
In general imports both imports and exports have turned down recently. There might be some bounce back soon.