Note: Data reported on Monday is always low, and is revised up as data is received.
 Click on graph for larger image.
This data is from the CDC.
According to the CDC, on Vaccinations.
KUDOS to the residents of the 20 states and D.C. that have achieved the 70% goal (percent over 18 with at least one dose): Vermont, Hawaii, Massachusetts and Connecticut are at 80%+, and Maine, New Mexico, New Jersey, Rhode Island, Pennsylvania, California, Maryland, Washington, New Hampshire, New York, Illinois, Virginia, Delaware, Minnesota, Oregon, Colorado and D.C. are all over 70%.
Total doses administered: 342,212,051, as of a week ago 338,247,434. Average doses last week: 0.57 million per day.
| COVID Metrics | ||||
|---|---|---|---|---|
| Today | Yesterday | Week Ago |
Goal | |
| Percent over 18, One Dose |
69.0% | 69.0% | 68.3% | ≥70.0%1,2 |
| Fully Vaccinated✅ (millions) |
163.2 | 163.0 | 161.5 | ≥1601 |
| New Cases per Day3🚩 | 42,226 | 45,332 | 34,465 | ≤5,0002 |
| Hospitalized3🚩 | 24,257 | 24,368 | 20,958 | ≤3,0002 |
| Deaths per Day3🚩 | 239 | 245 | 214 | ≤502 |
| 1 America’s Short Term Goals, 2my goals to stop daily posts, 37 day average for Cases, Hospitalized, and Deaths 🚩 Increasing 7 day average week-over-week for Cases, Hospitalized, and Deaths ✅ Goal met (even if late). |
||||
KUDOS to the residents of the 20 states and D.C. that have achieved the 70% goal (percent over 18 with at least one dose): Vermont, Hawaii, Massachusetts and Connecticut are at 80%+, and Maine, New Mexico, New Jersey, Rhode Island, Pennsylvania, California, Maryland, Washington, New Hampshire, New York, Illinois, Virginia, Delaware, Minnesota, Oregon, Colorado and D.C. are all over 70%.
Next up are Florida at 67.6%, Utah at 67.1%, Wisconsin at 66.9%, Nebraska at 66.7%, South Dakota at 65.7%, Kansas at 65.9%, Iowa at 65.1%, Nevada at 64.8% and Arizona at 64.1%.
 Click on graph for larger image.
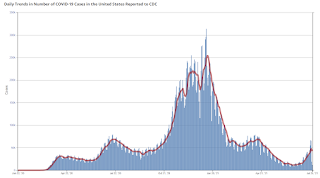
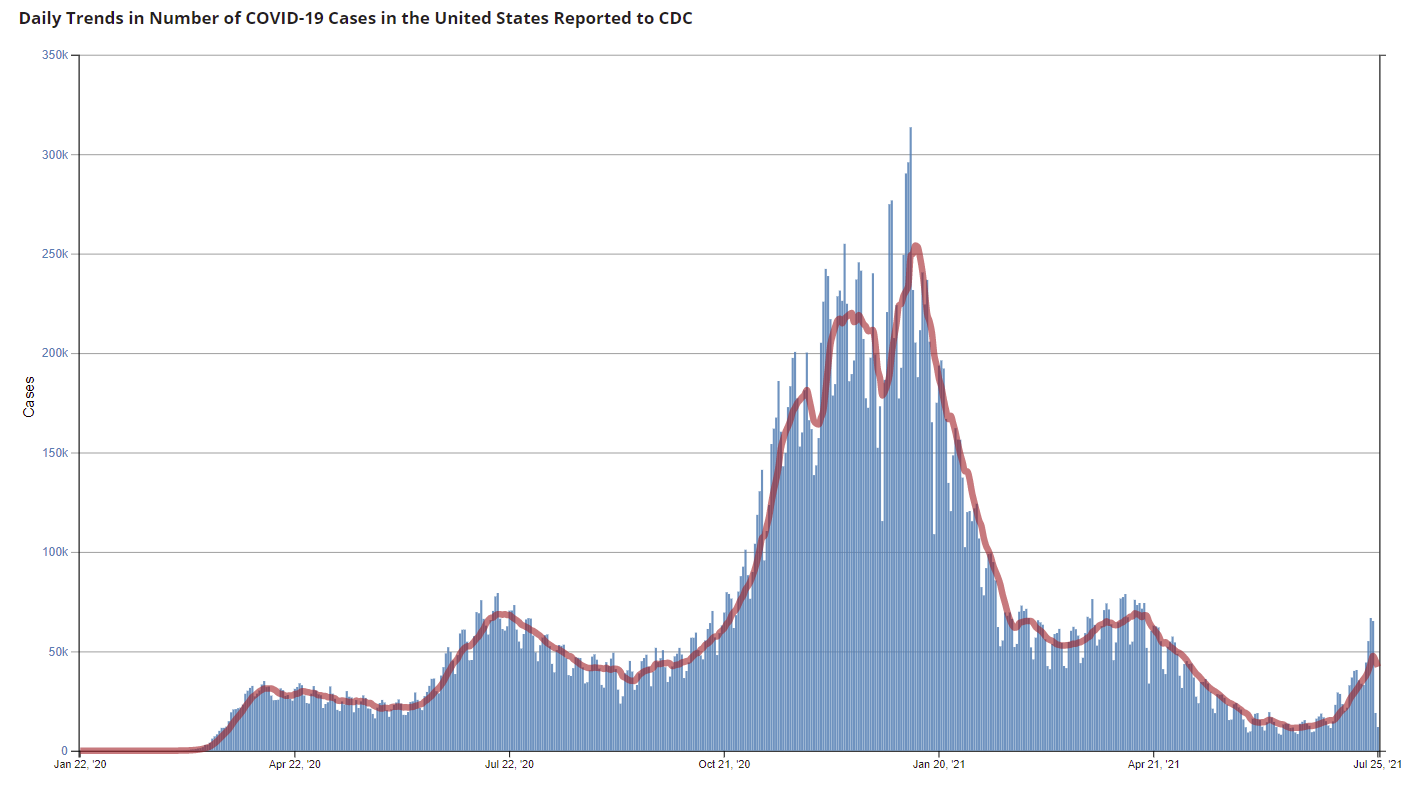
This graph shows the daily (columns) and 7 day average (line) of positive tests reported.
This data is from the CDC.