This data is from the CDC.
KUDOS to the residents of the 20 states and D.C. that have already achieved the 70% goal (percent over 18 with at least one dose): Vermont, Hawaii, Massachusetts and Connecticut are at 80%+, and Maine, New Mexico, New Jersey, Rhode Island, Pennsylvania, California, Maryland, Washington, New Hampshire, New York, Illinois, Virginia, Delaware, Minnesota, Oregon, Colorado and D.C. are all over 70%.
According to the CDC, on Vaccinations.
Total doses administered: 334,942,236, as of a week ago 331,214,347. Average doses last week: 0.53 million per day.
| COVID Metrics | ||||
|---|---|---|---|---|
| Today | Yesterday | Week Ago |
Goal | |
| Percent over 18, One Dose |
67.7% | 67.7% | 67.1% | ≥70.0%1,2 |
| Fully Vaccinated (millions) |
159.7 | 159.5 | 157.6 | ≥1601 |
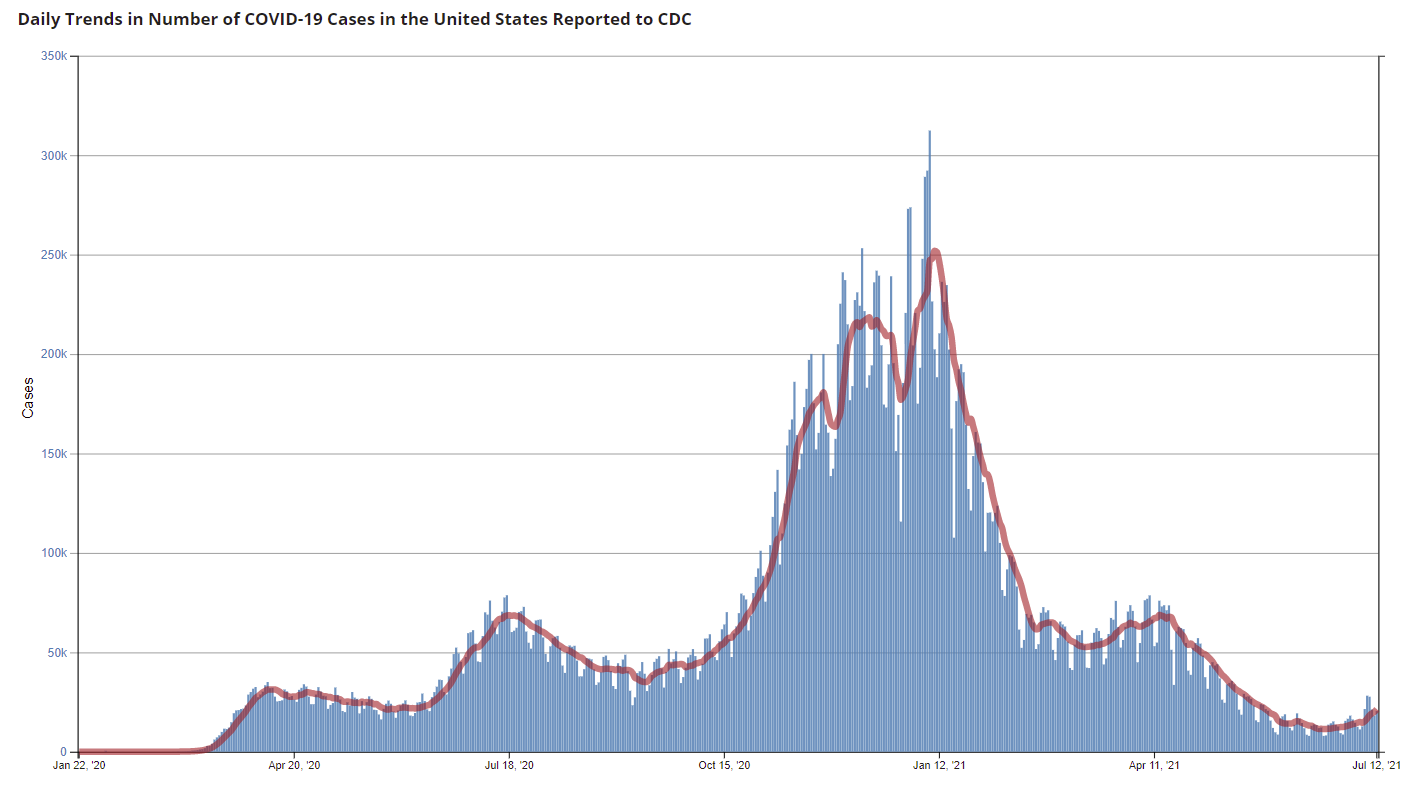
| New Cases per Day3🚩 | 21,420 | 20,100 | 14,981 | ≤5,0002 |
| Hospitalized3🚩 | 14,308 | 12,831 | 11,418 | ≤3,0002 |
| Deaths per Day3🚩 | 194 | 176 | 163 | ≤502 |
| 1 America’s Short Term Goals, 2my goals to stop daily posts, 37 day average for Cases, Hospitalized, and Deaths 🚩 Increasing 7 day average week-over-week for Cases, Hospitalized, and Deaths |
||||
KUDOS to the residents of the 20 states and D.C. that have already achieved the 70% goal (percent over 18 with at least one dose): Vermont, Hawaii, Massachusetts and Connecticut are at 80%+, and Maine, New Mexico, New Jersey, Rhode Island, Pennsylvania, California, Maryland, Washington, New Hampshire, New York, Illinois, Virginia, Delaware, Minnesota, Oregon, Colorado and D.C. are all over 70%.
Next up are Wisconsin at 66.1%, Florida at 65.9%, Nebraska at 65.9%, Utah at 65.2%, South Dakota at 64.8%, and Iowa at 64.4%.
 Click on graph for larger image.
This graph shows the daily (columns) and 7 day average (line) of positive tests reported.
This data is from the CDC.
The 7-day average cases is the highest since May 26th.