“Vaccinations in the U.S. began Dec. 14 with health-care workers, and so far 23.5 million shots have been given, according to a state-by-state tally by Bloomberg and data from the Centers for Disease Control and Prevention. In the last week, an average of 1.25 million doses per day were administered.”
Also check out the graphs at COVID-19 Vaccine Projections The site has several interactive graphs related to US COVID vaccinations including a breakdown of how many have had one shot, and how many have had both shots.
It is possible the 7-day average cases has peaked. Stay safe! I’m looking forward to not posting this data in a few months.
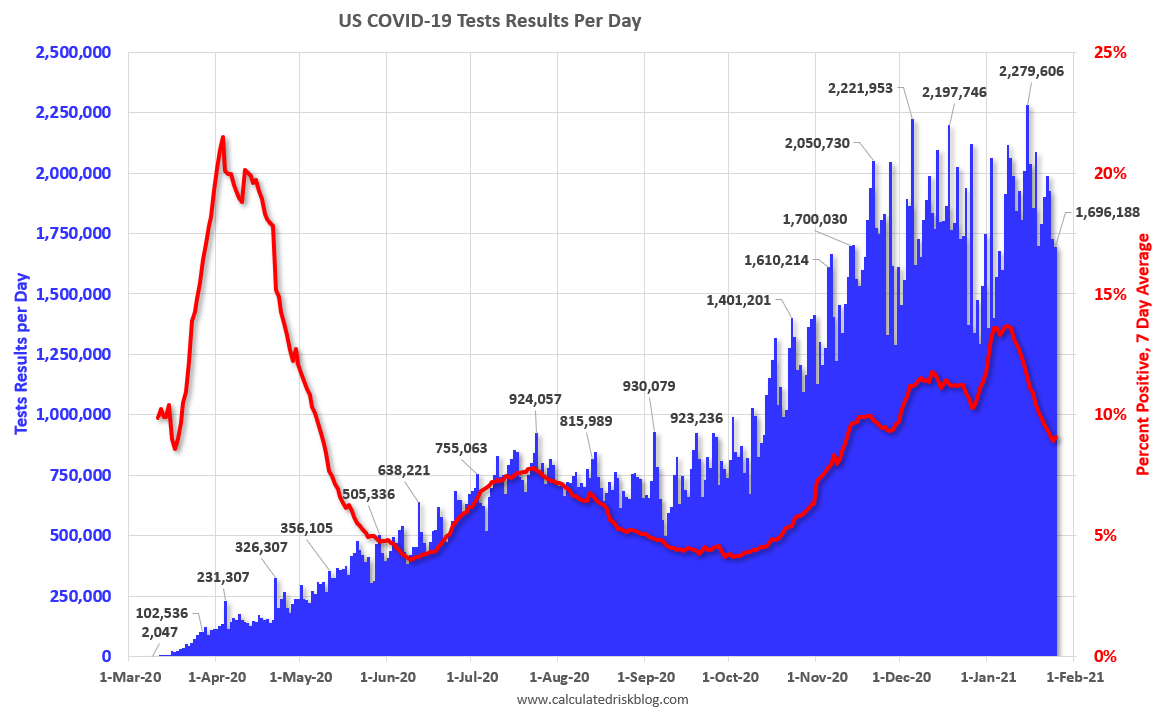
There were 1,696,188 test results reported over the last 24 hours.
There were 133,067 positive tests.
Over 75,000 US deaths have been reported so far in January. See the graph on US Daily Deaths here.
 Click on graph for larger image.
This data is from the COVID Tracking Project.
The percent positive over the last 24 hours was 7.8% (red line is 7 day average). The percent positive is calculated by dividing positive results by total tests (including pending).
And check out COVID Act Now to see how each state is doing. (updated link to new site)
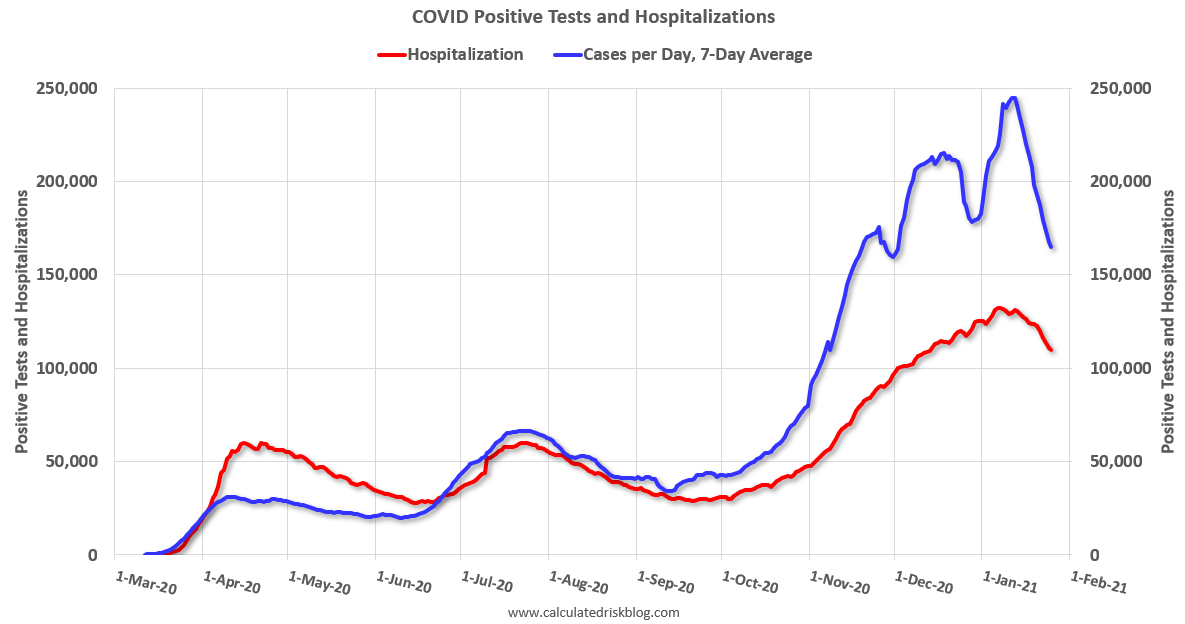 The second graph shows the 7 day average of positive tests reported and daily hospitalizations.
It is possible cases and hospitalizations have peaked, but are declining from a very high level.