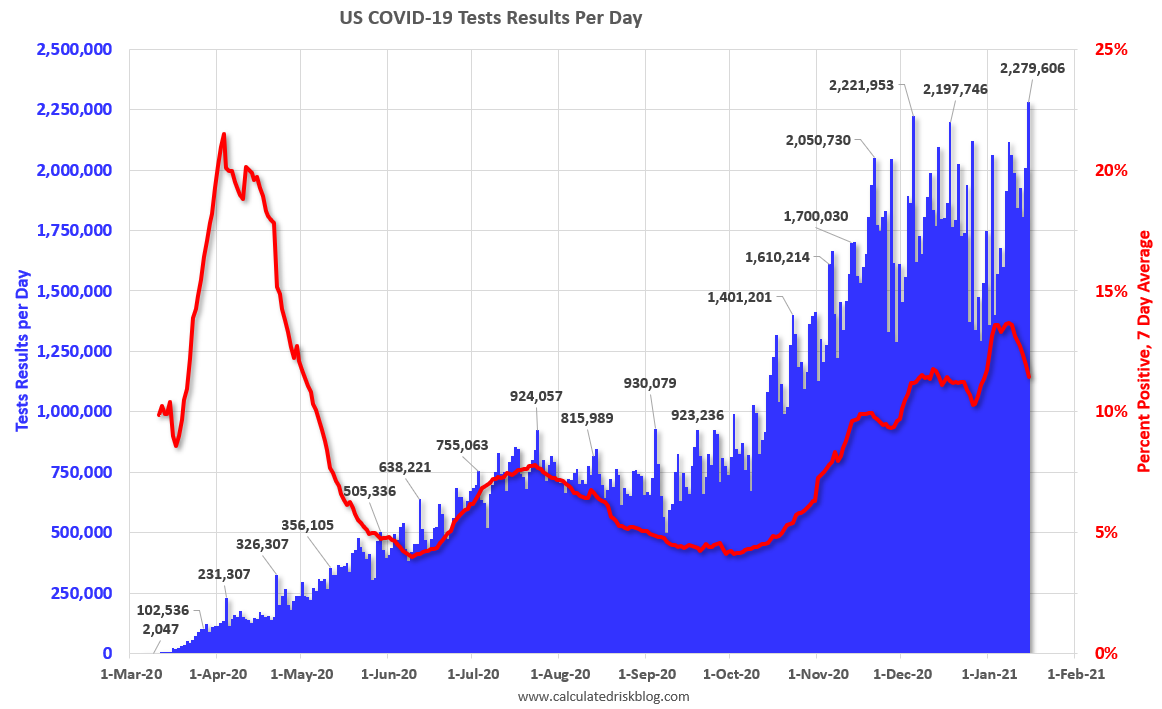
The US is now averaging close to 2 million tests per day. Based on the experience of other countries, for adequate test-and-trace (and isolation) to reduce infections, the percent positive needs to be under 5% (probably close to 1%), so the US has far too many daily cases – and percent positive – to do effective test-and-trace.
There were 2,279,606 test results reported over the last 24 hours.
There were 243,996 positive tests.
Over 46,000 US deaths have been reported so far in January. See the graph on US Daily Deaths here.
 Click on graph for larger image.
This data is from the COVID Tracking Project.
The percent positive over the last 24 hours was 10.7% (red line is 7 day average). The percent positive is calculated by dividing positive results by total tests (including pending).
And check out COVID Act Now to see how each state is doing. (updated link to new site)
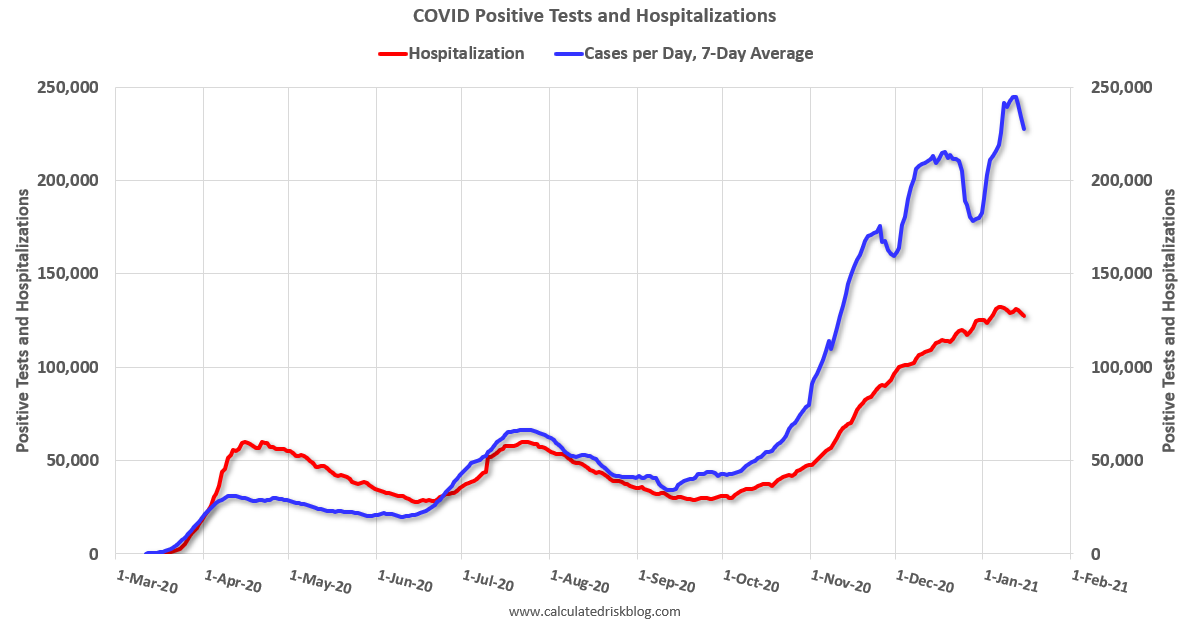 The second graph shows the 7 day average of positive tests reported and daily hospitalizations.
It is possible cases and hospitalizations have peaked, but are still at a very high level.