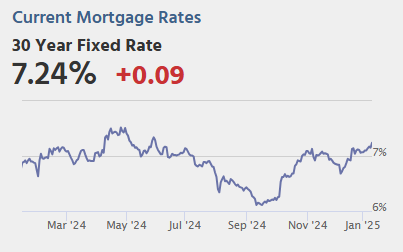
 Note: Mortgage rates are from MortgageNewsDaily.com and are for top tier scenarios.
For deaths, I’m currently using 4 weeks ago for “now”, since the most recent three weeks will be revised significantly.
Note: “Effective May 1, 2024, hospitals are no longer required to report COVID-19 hospital admissions, hospital capacity, or hospital occupancy data.” So I’m no longer tracking hospitalizations.
| COVID Metrics | ||||
|---|---|---|---|---|
| Now | Week Ago |
Goal | ||
| Deaths per Week🚩 | 500 | 450 | ≤3501 | |
| 1my goals to stop weekly posts. 🚩 Increasing number weekly for Deaths. ✅ Goal met. |
||||
 Click on graph for larger image.
This graph shows the weekly (columns) number of deaths reported for the last 2 years.
Although weekly deaths met the original goal to stop posting, I’m continuing to post now that deaths are above the goal again – and at a minimum, I’ll continue to post through the Winter.
Weekly deaths have mostly been declining, however weekly deaths are still above the low of 313 in early June 2024.
And here is a graph I’m following concerning COVID in wastewater as of January 2nd:
 This appears to be a leading indicator for COVID hospitalizations and deaths.
Natinally COVID in wastewater is “HIGH” according to the CDC – especially in the Midwest where it is “Very High” – and more than triple the lows of last May – and increasing. Something to watch.