For the last couple months, when someone would bring up some bullish argument, my response would usually be something like, “Sure, but we’re still below the 50-day moving average.”
I’ve learned that this game is all about identifying a key level, price, signal, or what I call a “line in the sand,” at which point you agree to revisit your investment thesis. This has helped me to avoid some of the temptation of behavioral biases like confirmation bias and endowment bias and focus more on the evidence that the markets provide.
So, when the S&P 500 broke above the 50-day moving average this week, I definitely took notice.
For me, the 50-day moving average is a key component to understanding trend. The 50-day moving average represents about 20% of the trading days in a calendar year, or about two and a half months. Quite simply, when the price is above its average price for the last couple months, that’s bullish.
But here’s the catch: it’s all about time frames.
You see, if I’m trying to look out a couple months as an investment horizon, I want to be focused on the longer-term trends (which I like to capture with my Market Trend Model), but also understand the shorter-term fluctuations. The price breaking above the 50-day moving average tells me that the short-term picture has improved to the point the S&P 500 has broken above this key trend barometer. But we can take it a step further and see how the members of the S&P 500 index are faring against their own 50-day moving averages.
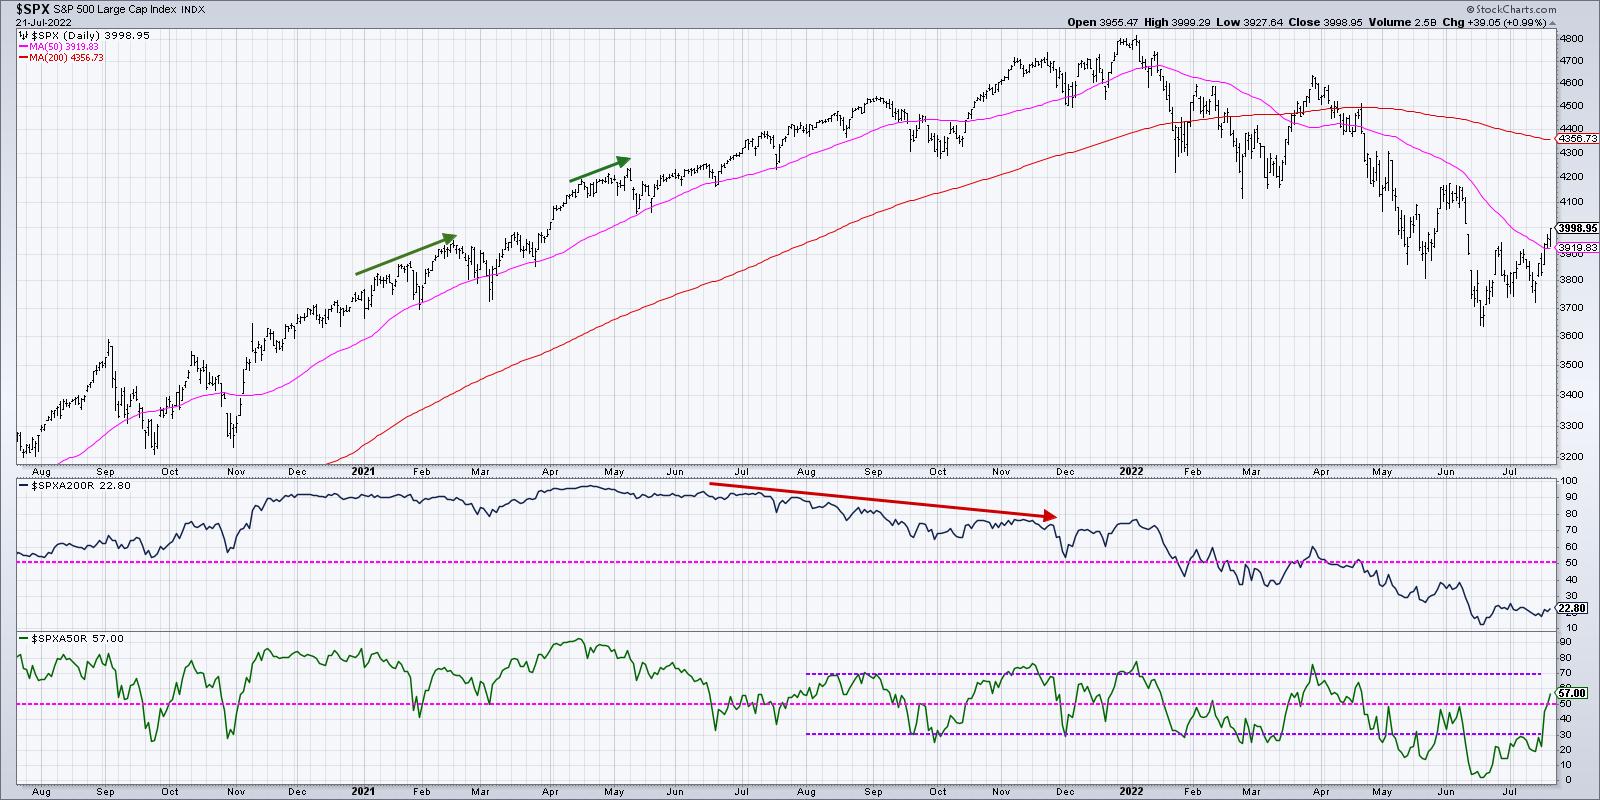
As of Thursday’s close, 57% of the S&P 500 members were trading above their 50-day moving average. That’s up from about 3-5% in mid-June. So, in one month, over half of the S&P 500 stocks have gone from below their 50-day to above their 50-day.
That’s a decent rotation for a fairly large number of stocks. But is it sustainable?
Do your eyes glaze over when someone starts talking “doji” or “hammer” candles? We’ve got you covered! Here’s our latest video covering how to trade using common candle patterns.
Starting in August 2021, most rallies have stalled out when this indicator has reached to 70%. We saw that in August 2021, November 2021, January 2022 and March 2022. A couple other bear market rallies saw this indicator rise only to around 50% in February 2022 and June 2022.
The March rally may be a good parallel to what we’re seeing now. Are the broad macro conditions significantly better than before? I don’t believe so. But investors are clearly buying into the short-term bull thesis and bidding stocks higher. In March, that pushed the S&P 500 right up to previous resistance around 4600 before the downtrend resumed.
Given the strength in stocks leading into next week’s Fed meeting, I could see a rally to the June high in the 4100-4200 range. Let’s see what percent of S&P 500 members are above their 50-day moving average if the market reaches that upside objective.
As an investor, you should have three goals every day:
- Identify trends
- Follow those trends
- Anticipate when those trends are changing.
That’s it. So far in 2022, the trends have been largely down, and we’ve enjoyed tracking that downward phase on my show, The Final Bar. But I’ve seen enough short-term strength to cause me to focus on that crucial third goal.
The most bullish thing the market can do is go up. And on the tactical time frame, we’ve certainly seen that play out this week.
RR#6,
Dave
P.S. Ready to upgrade your investment process? Check out my YouTube channel!
David Keller, CMT
Chief Market Strategist
StockCharts.com
Disclaimer: This blog is for educational purposes only and should not be construed as financial advice. The ideas and strategies should never be used without first assessing your own personal and financial situation, or without consulting a financial professional.
The author does not have a position in mentioned securities at the time of publication. Any opinions expressed herein are solely those of the author, and do not in any way represent the views or opinions of any other person or entity.