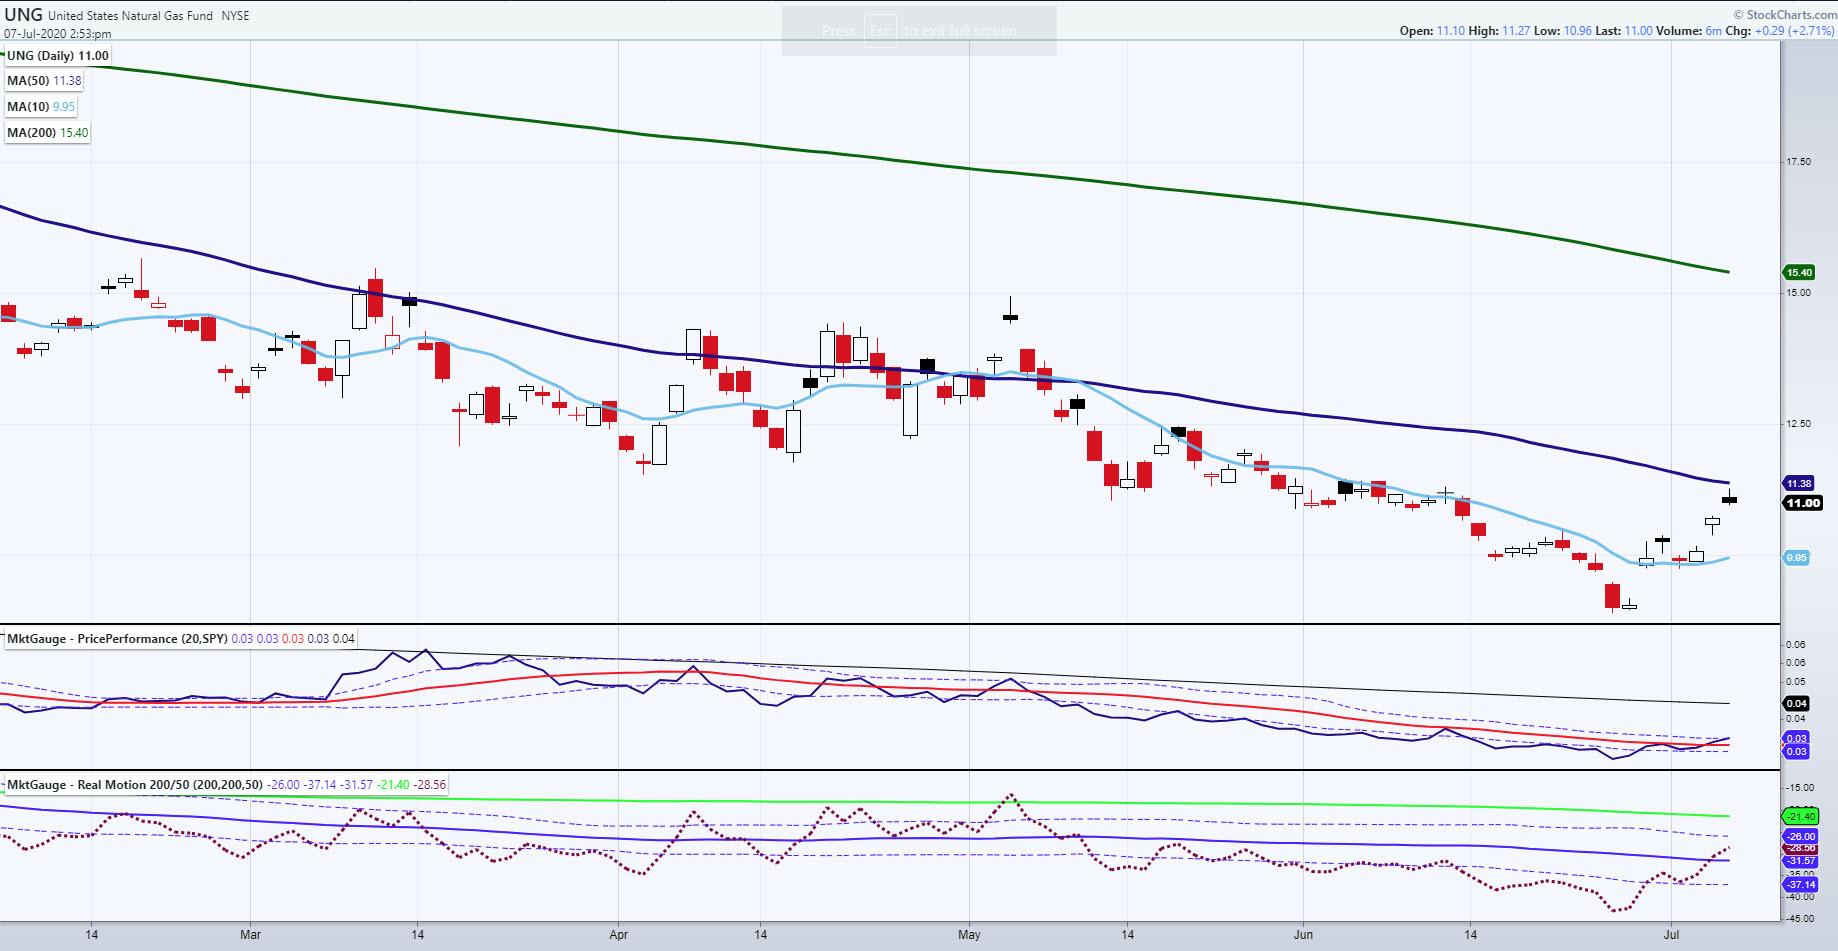
Rare to see an island bottom. However, the one in UNG, the ETF for natural gas, had a classic one. After making new all-time lows, an island confirmation suggests a reversal of the downtrend.
But that’s not all. Warren Buffett bought Dominion Energy (D), a company that heats and cools 7.5 million customers (small) in 18 states with electricity and natural gas. For Buffett, this is a value play. For me, after seeing the UNG chart, I like to think of it as also a commodities play.
Why else is this island bottom so compelling?
The other two indicators on the chart are MarketGauge Proprietary indicators. The middle one is a price performance comparison to a key benchmark. UNG has begun to outperform that benchmark.
The bottom chart shows our Real Motion indicator – and that’s where things get really interesting. The momentum shows price well above the 50-DMA, while the actual price trades just below the 50-DMA. This type of divergence is compelling and worth watching to see if price can catch up to momentum.
Island bottom, momentum and Buffett – now there is an oh my!
- S&P 500 (SPY): 318.22 is a gap that must fill. 315 pivotal, 310 support
- Russell 2000 (IWM): 141 then 137 support, 146.50 resistance
- Dow (DIA): 257 support, 262.50 resistance
- Nasdaq (QQQ): Inverted hammer doji after making new highs; could be forced selling, could be a reversal
- KRE (Regional Banks): Hinging on support here
- SMH (Semiconductors): 155 support – 160 target
- IYT (Transportation): 161.50 pivotal support, 170 resistance
- IBB (Biotechnology): 137.60 closest support
- XRT (Retail): 43.40 huge support to hold
- Volatility Index (VXX): Still in caution phase, but also clears 32.70
- Junk Bonds (JNK): 104.50 resistance, 101.50 support
- LQD (iShs iBoxx High-Yield Bonds): New highs again – watch 134.90
Mish Schneider
MarketGauge.com
Director of Trading Research and Education