The Dow theory is more than 100 years old but still holds value today. Sometimes simple things can help you paint a clearer picture for yourself.
One of the principles of the Dow Theory is that “Indices Must Confirm Each Other.” Basically, this means that signals or trends in one index must match the same signals/trends in the other index. We are talking about the Industrials and the Transportation indexes as those were the only two available when the theory was described.
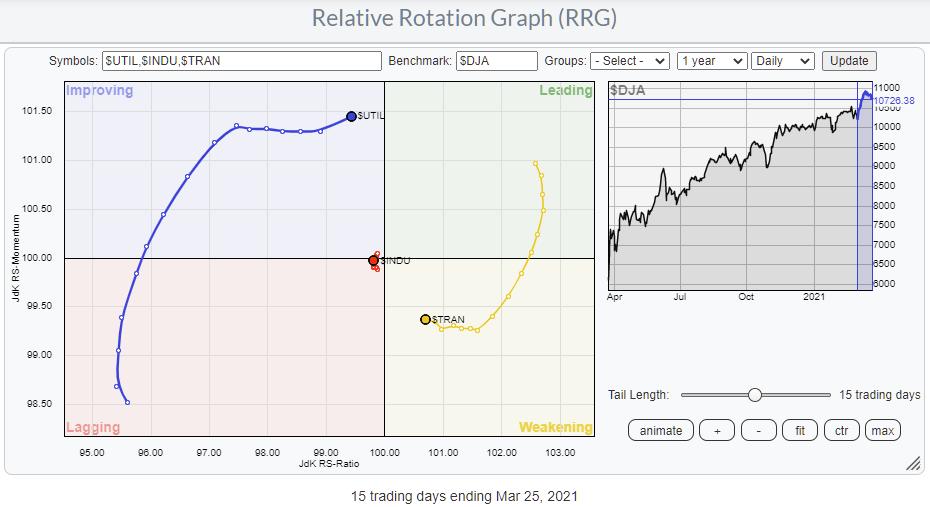
Generally, we want to apply this to longer-term, say weekly at the minimum, charts. But, every new trend starts small, so for this article, I threw the three Dow Indices, Industrials, Transportation, and Utilities, on a Relative Rotation Graph to see what’s happening at this level.
The Industrials had crossed over to lagging already a while ago, on 1 March actually. Following that deterioration, the Transportation index started to roll over while still inside leading and subsequently rotated into the lagging quadrant.
During that move in Transportation, the Utilities index rotated from lagging into improving and is now rapidly approaching the leading quadrant.
So the message from RRG based on the daily time-frame is weakening for TRAN and INDU and strengthening for UTIL. More or less a risk-off message.
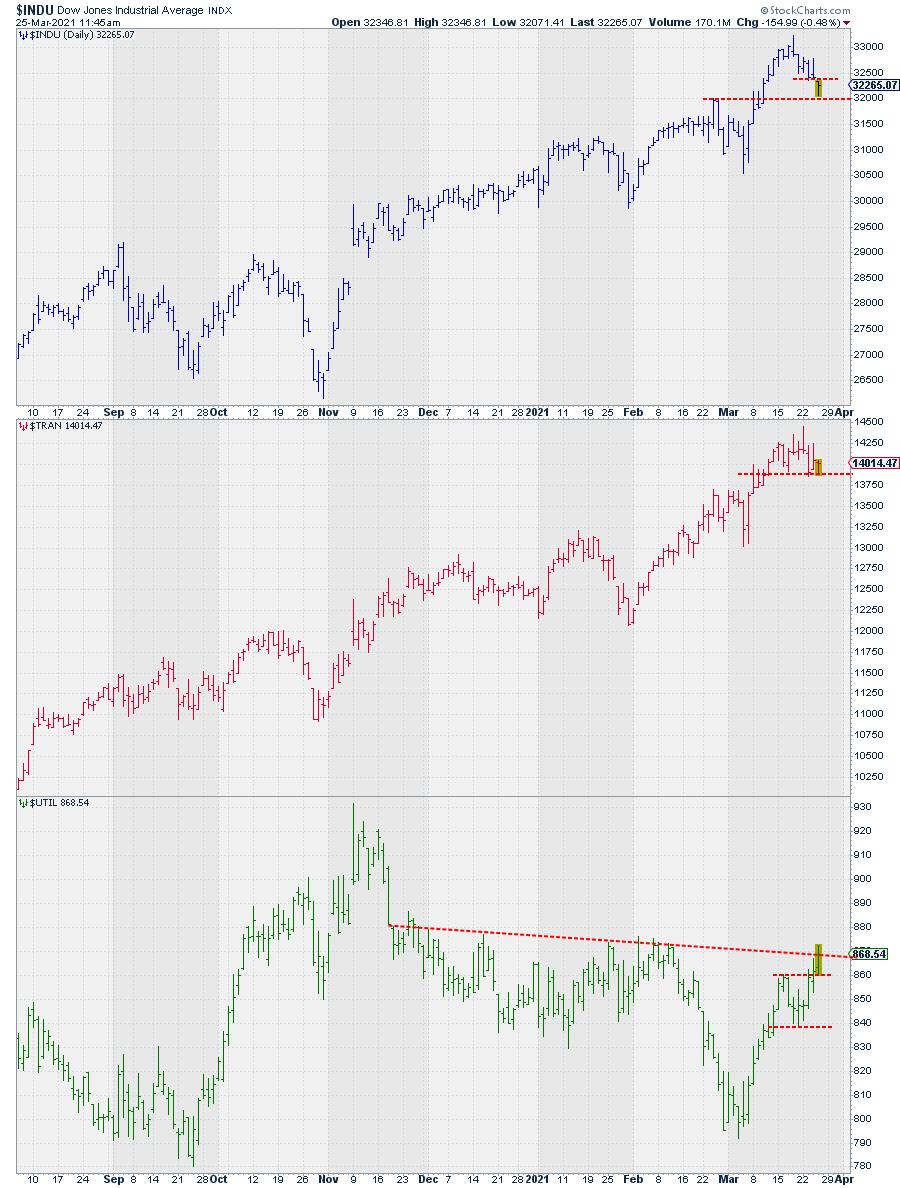
The chart above shows the three Dow indexes, INDU, TRAN, and UTIL, stacked on top of each other.
INDU and TRAN show topping characteristics while UTIL is about to break above an almost horizontal resistance level that connects the highs since late December.
Even though the long-term trend, when looking at the Dow Theory, is up, we may see some sort of a correction in the near future.
For the Industrials index, the first serious support level is near 29.000 (the high of Feb 2020)
My regular blog is the RRG Charts blog. If you would like to receive a notification when a new article is published there, simply “Subscribe” with your email address.